
SitRep #2 (Rate Hikes & Stagflation)
Macroeconomic Situation Report by Andoni Ortun.

Stagflation in the US:
The United States is facing stagflation, as statistics show a rising inflation rate with lackluster job market growth, which is mainly constrained due to higher costs; hence, it’s coherent to keep positioned for rate hikes, as it’s more than likely that the FOMC will be focused on the inflation side of the dual mandate, mostly given the fact that the unemployment rate edged lower while inflation edged higher.
TL;DR: higher inflation + lower unemployment rate = rate hikes.
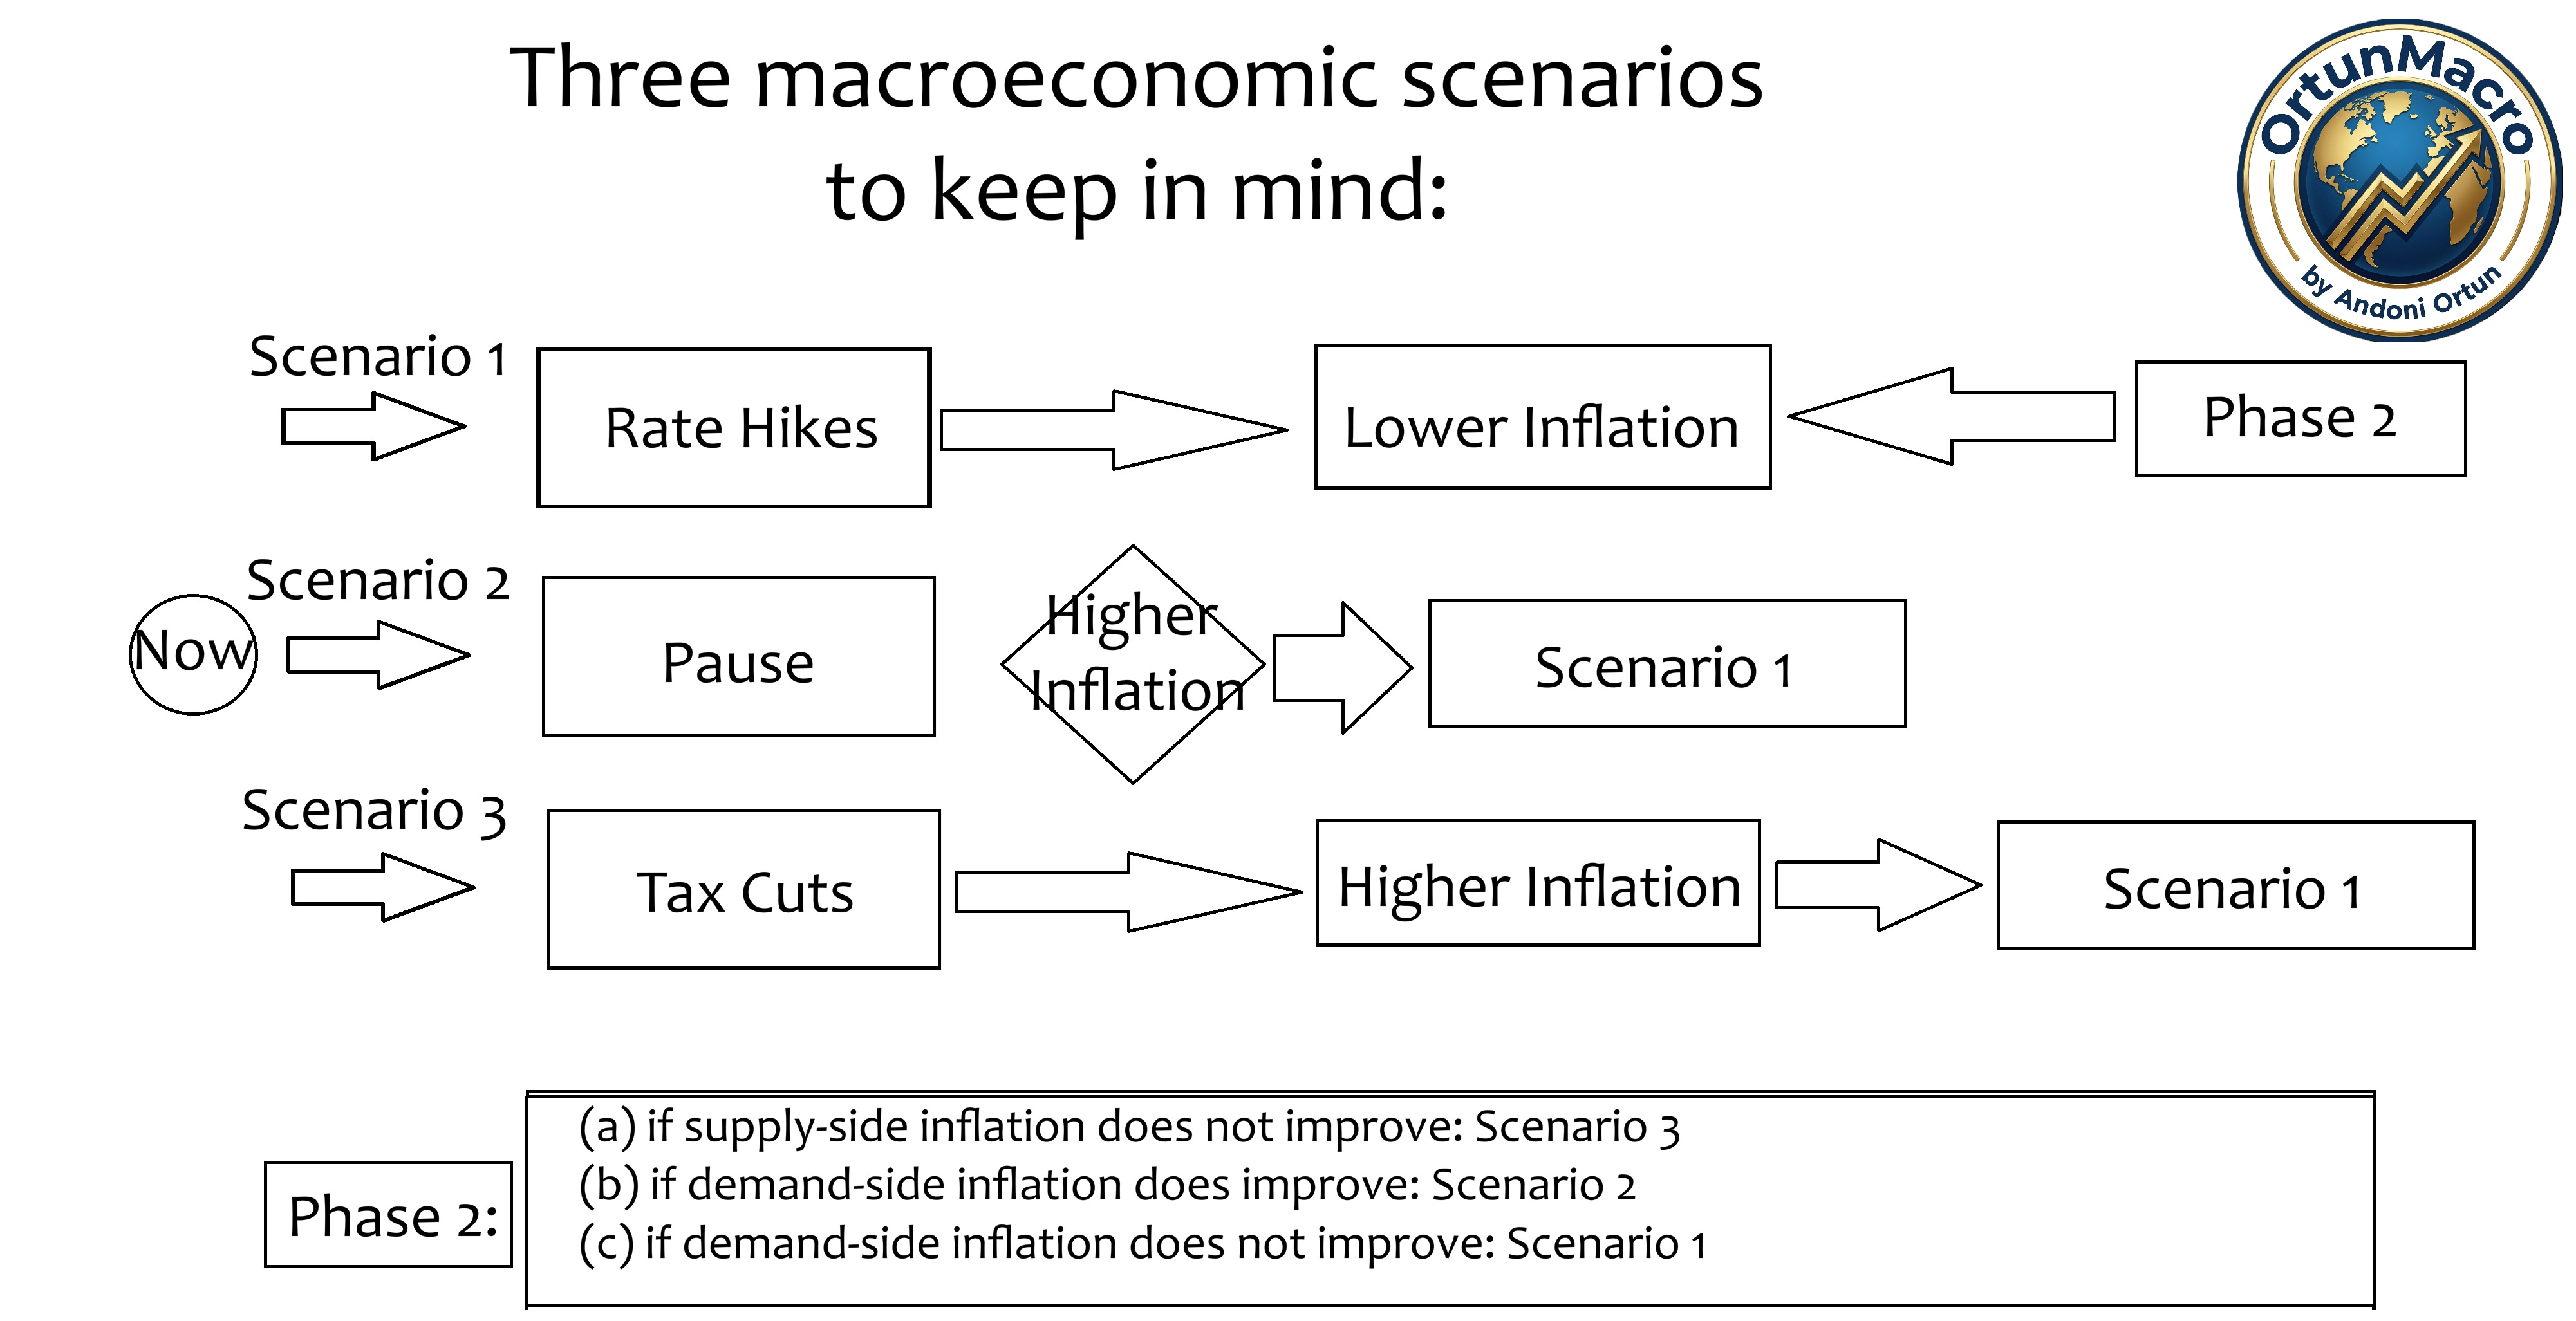
Figure 1. The Unemployment Rate Edged Lower:
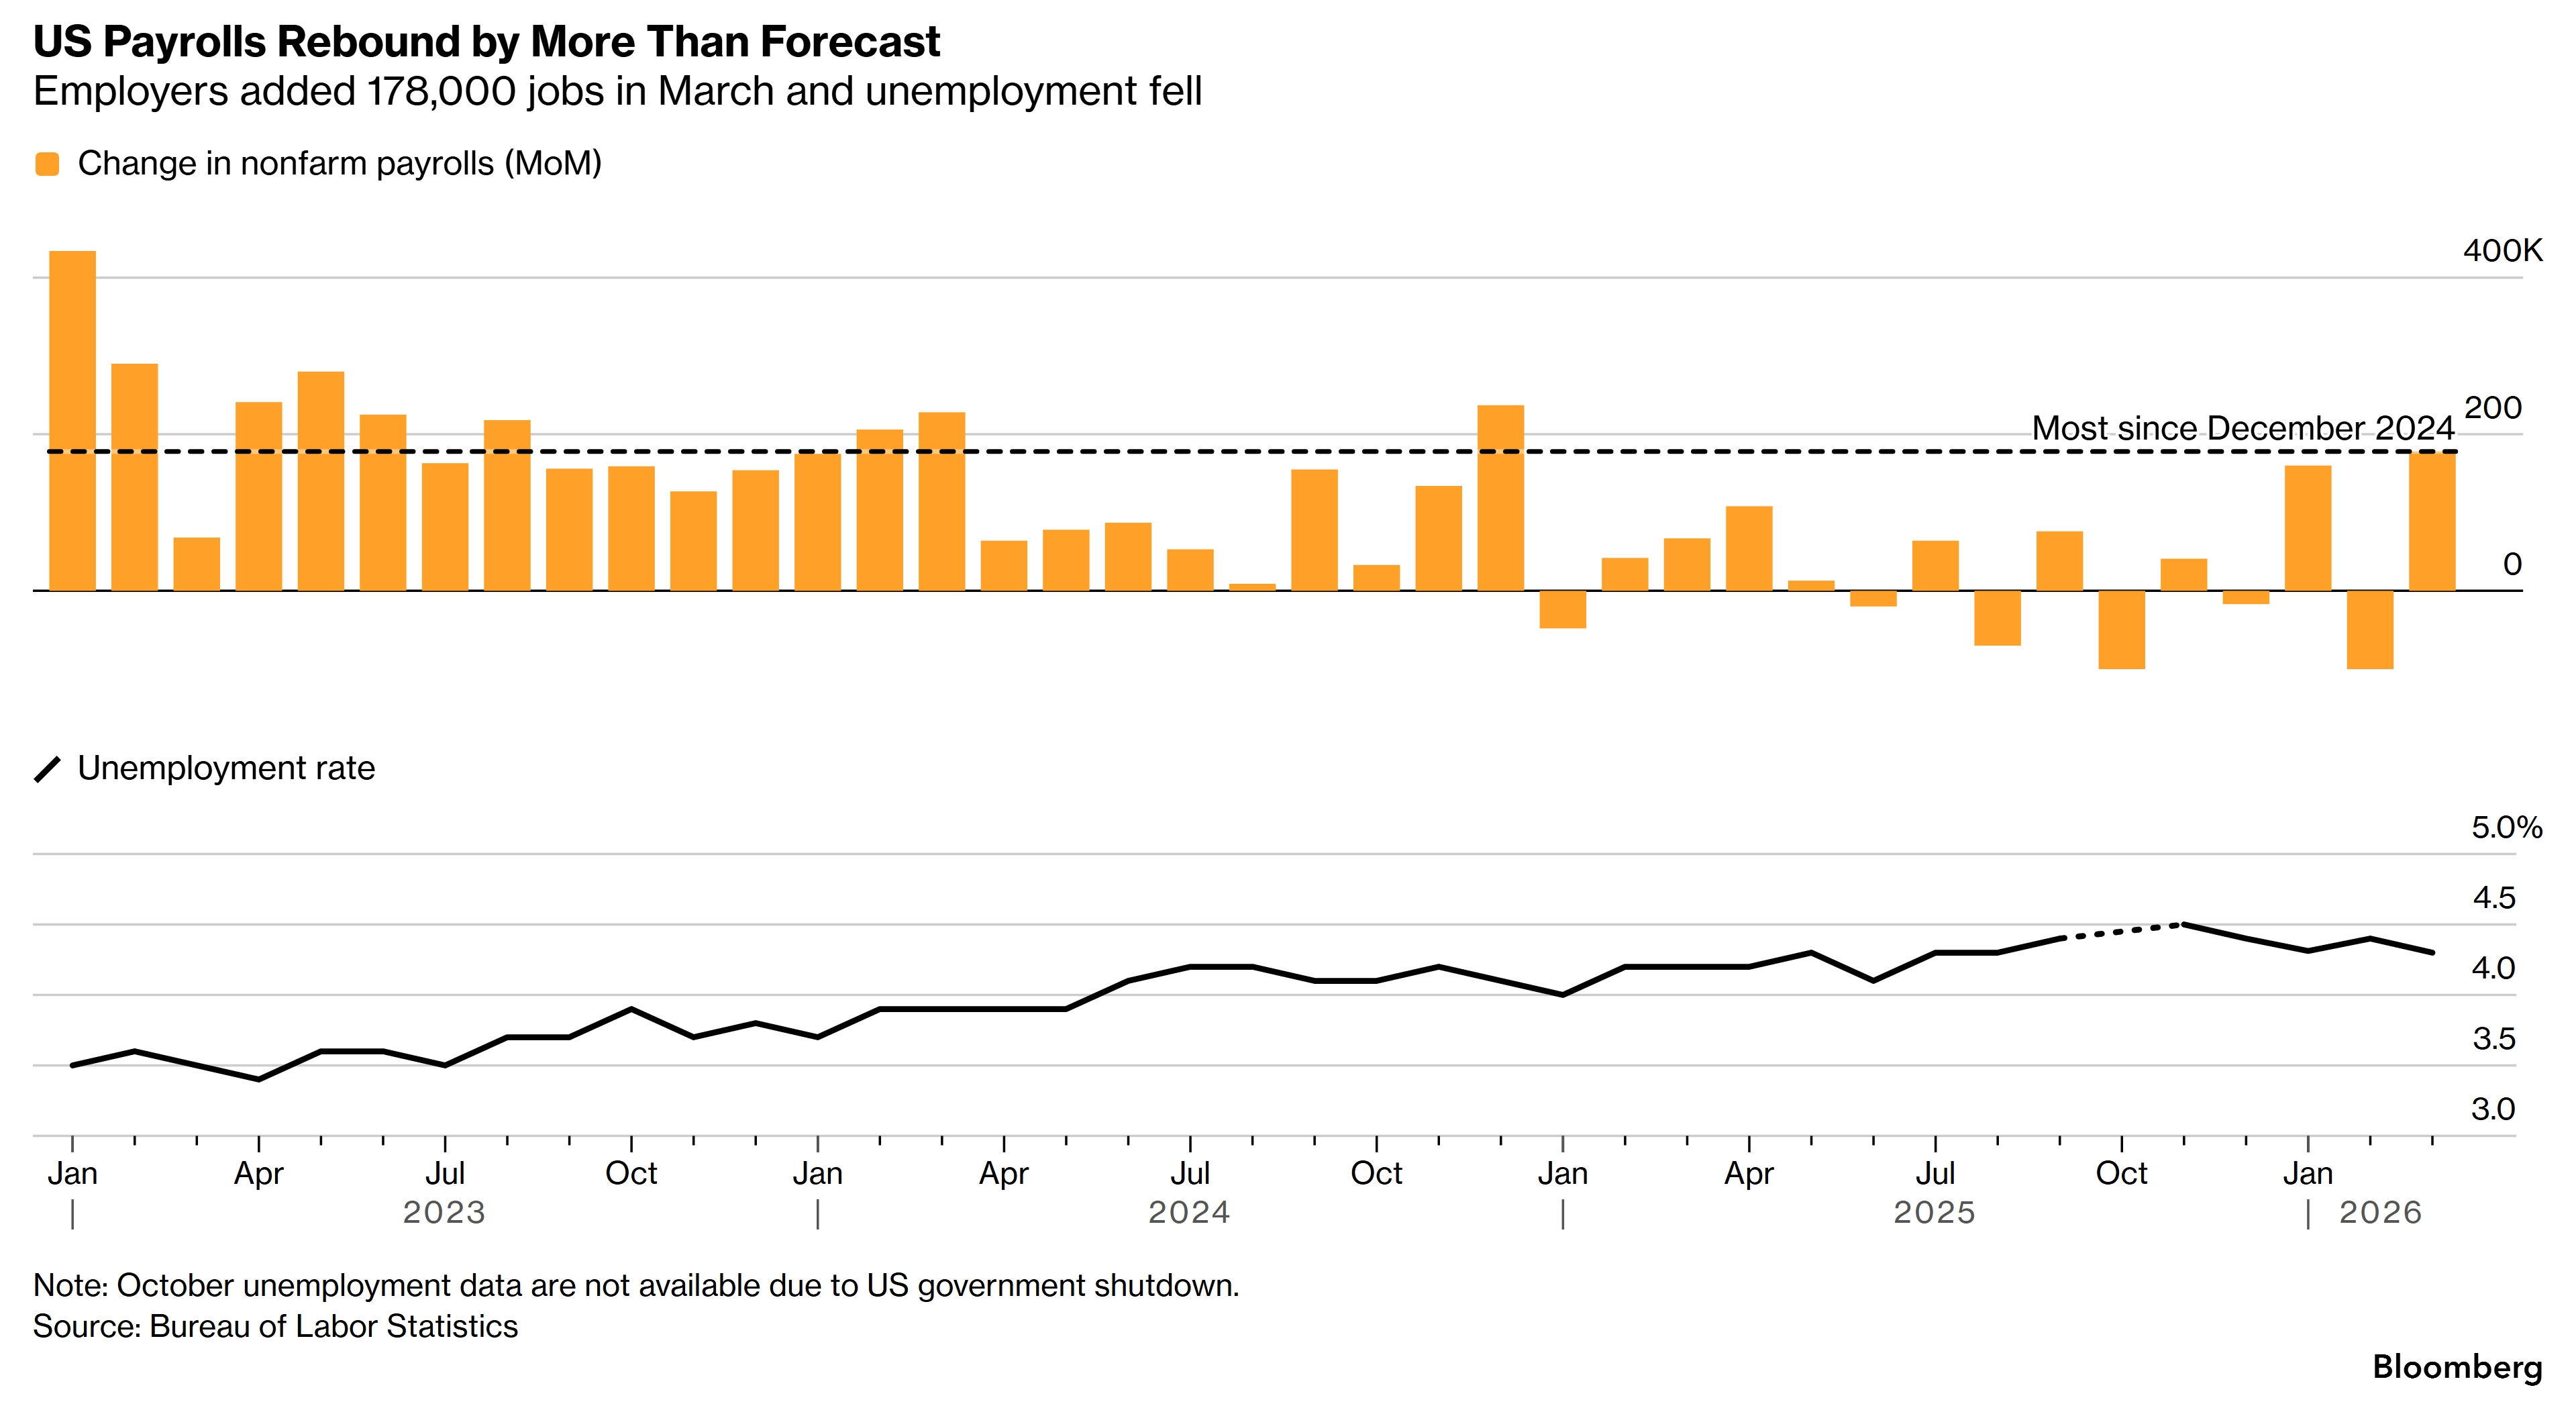
Figure 2. Almost 9% Implied Inflation Rate.
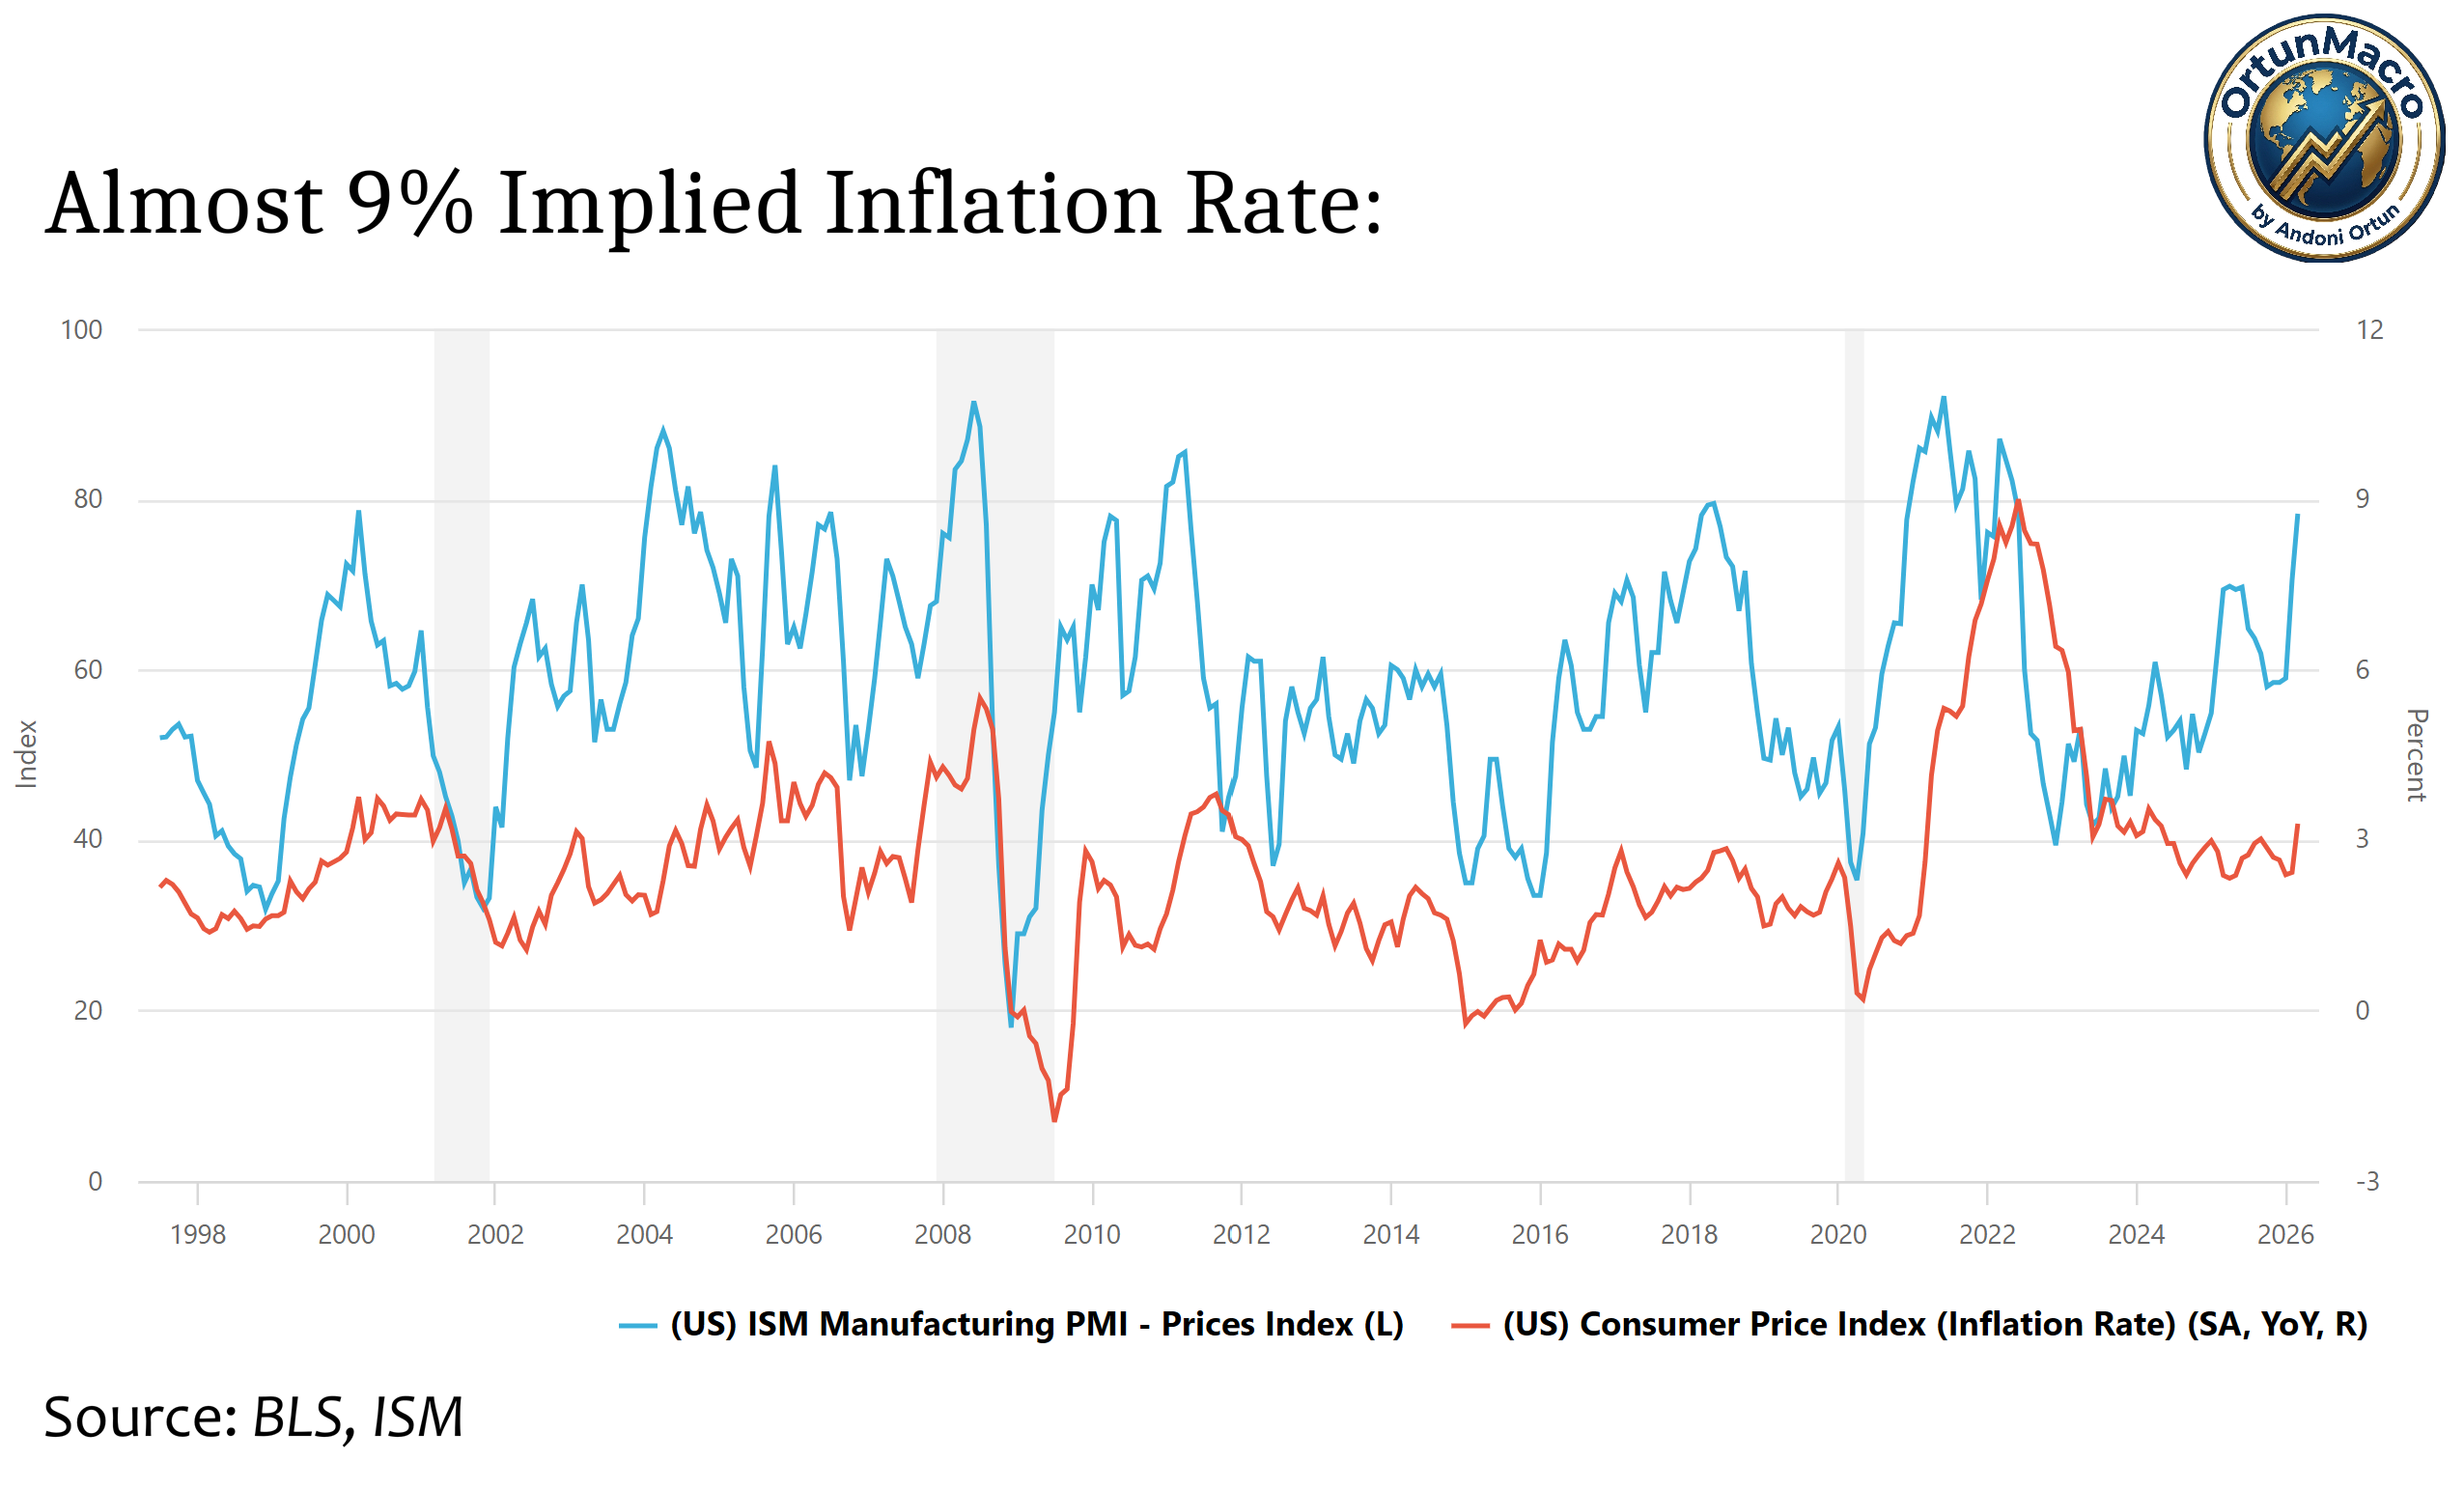
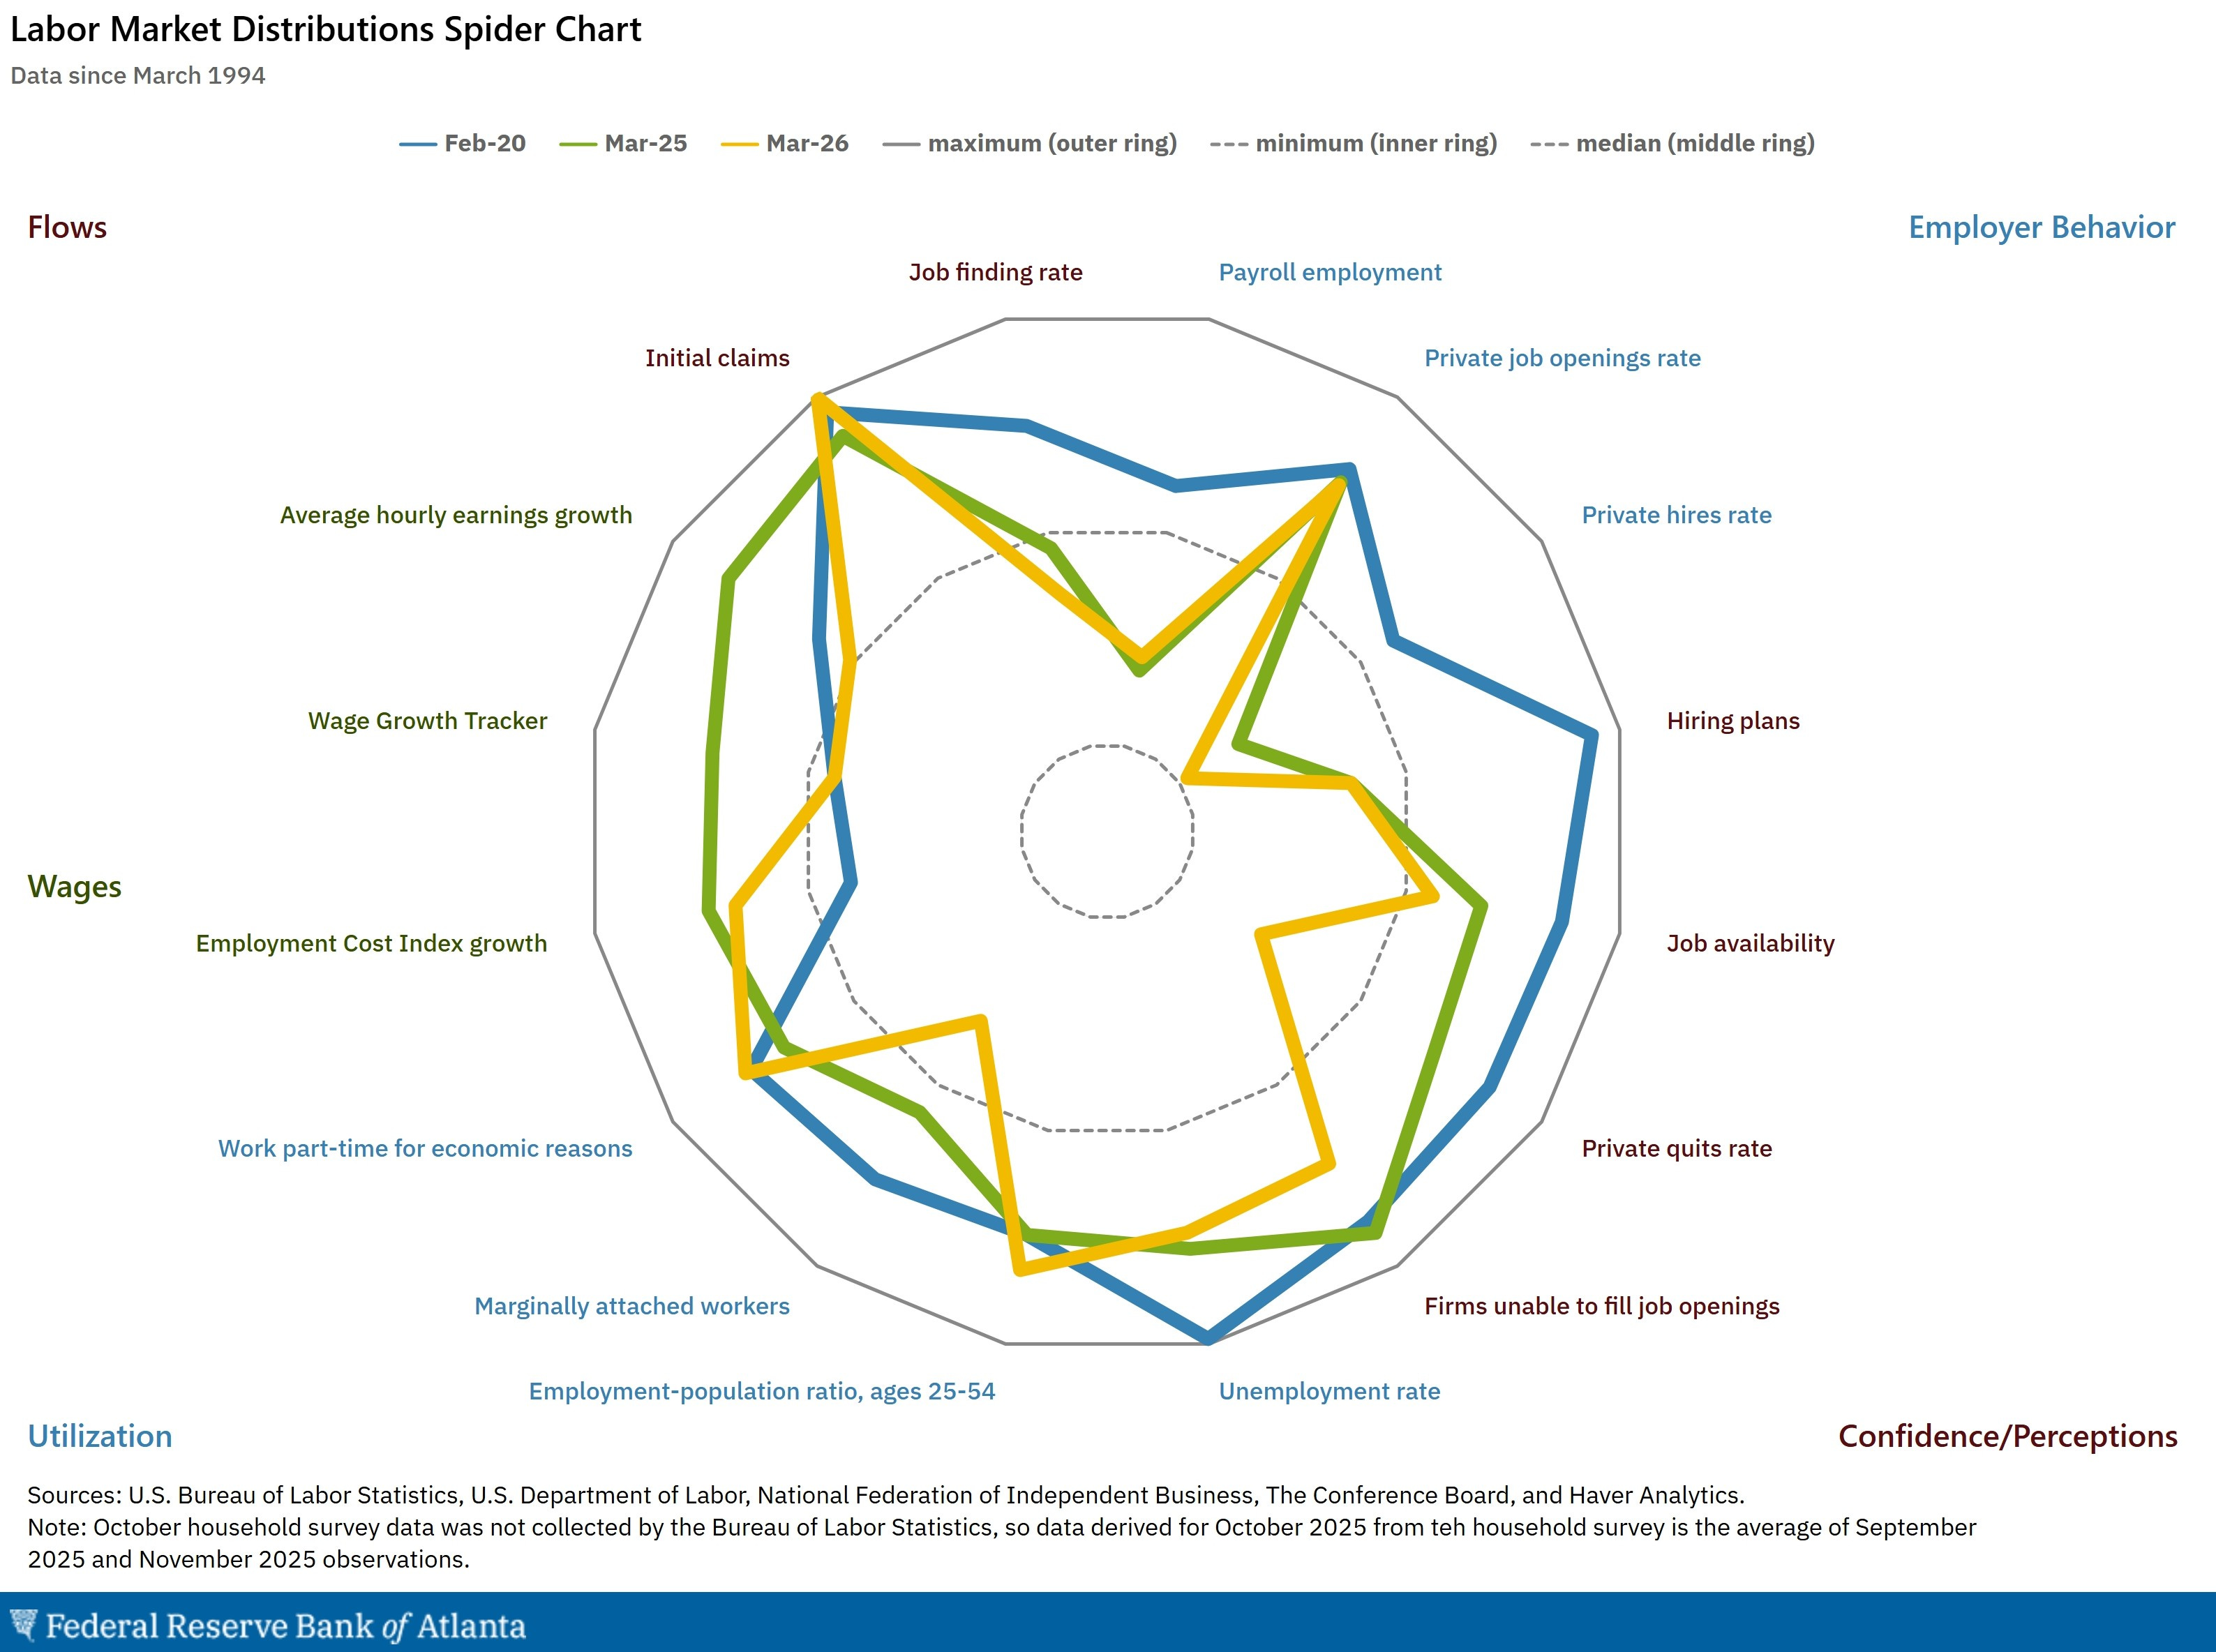
Figure 3. Low Unemployment Rate With Elevated Employment Cost:
Given the previous statistics, I strongly believe that there will be rate hikes, a pause would be a mistake given the fact that inflation edged higher and the unemployment rate edged lower. The next chart shows where rates should be.
Figure 4. This Is Where Rates Should Be At:
Figure 5. FOMC Officials Dove/Hawk Stance:
Markets may be underpricing the inflation risk given the market-priced rate stance in the SOFR futures market. The increase in oil prices has not yet materialized into the economy; it’s reflected in the consumer sentiment but not in the economy yet.
Figure 6. Lowest Consumer Sentiment Ever In The United States.
The current geopolitical scenario is shifting from regional to global, supply chain disruptions will likely keep generating supply-side inflationary pressures, mainly driving energy prices in the first two quarters, then extends into the greater economy as most goods and services rely in oil derivatives such as gasoline for transportation and oil for goods production, which costs increases end up passed onto consumers.
Figure 7. Oil Is Cheap Relative To Supply Disruptions Given Warfare:

Figure 8. Oil Scenarios To Keep In Mind Given Regional Warfare:

I strongly believe that if the Pentagon or the CIA/DIA did what they did in Lybia, the Iran would have developed in a different way, and NATO would’ve intervened in it, like NATO did in 2011 in Libya. Developing (the CIA/DIA) a civil war in the region by arming militias against the government would’ve worked, and there would’ve been a bullshit excuse in the United Nations for NATO to intervene, like it happened in 2011. I strongly believe that the Pentagon thought this was another war against an underdeveloped nation until they faced the harsh truth of China and Russia defending Iran, as it’s a BRICS ally. The truth is that America is not winning this war, and taxpayers are paying for its costs.
Figure 9. The Iran War Is Costing American Taxpayers Almost $50B.
This doesn’t mean that there isn’t opportunity in this war; oil remains a hedge on this war, but as I mentioned before, munition maker stocks are undervalued as long as this war continues. My main hedge for this war was gasoline retailers like Murphy USA Inc. ( MUSA 0.00%↑ ) stock, which surpassed my price target, I do still believe it’s undervalued.

Figure 10. Americans Lack Confidence In The Government’s Handling Of The Iran War:
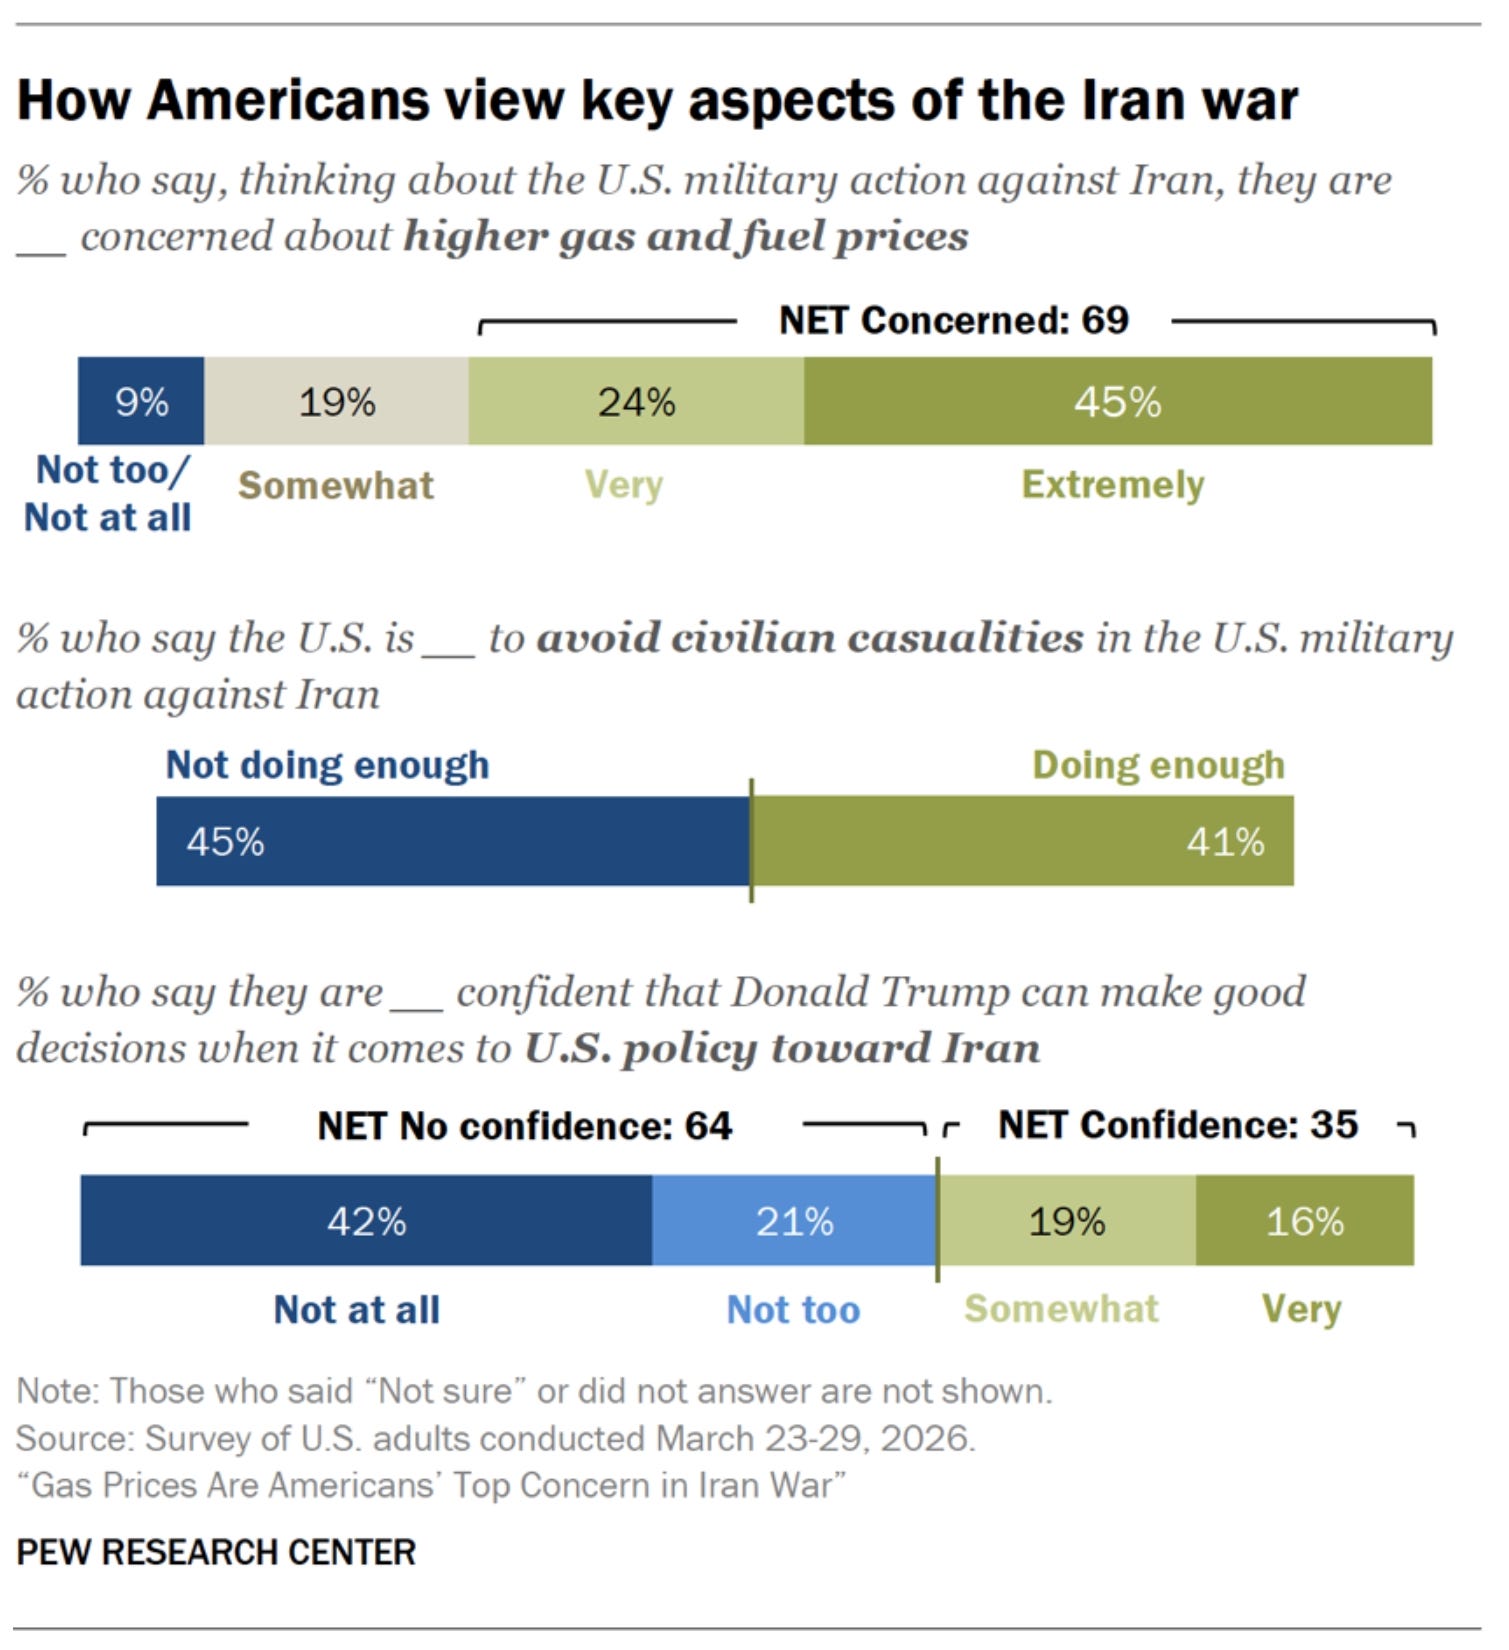
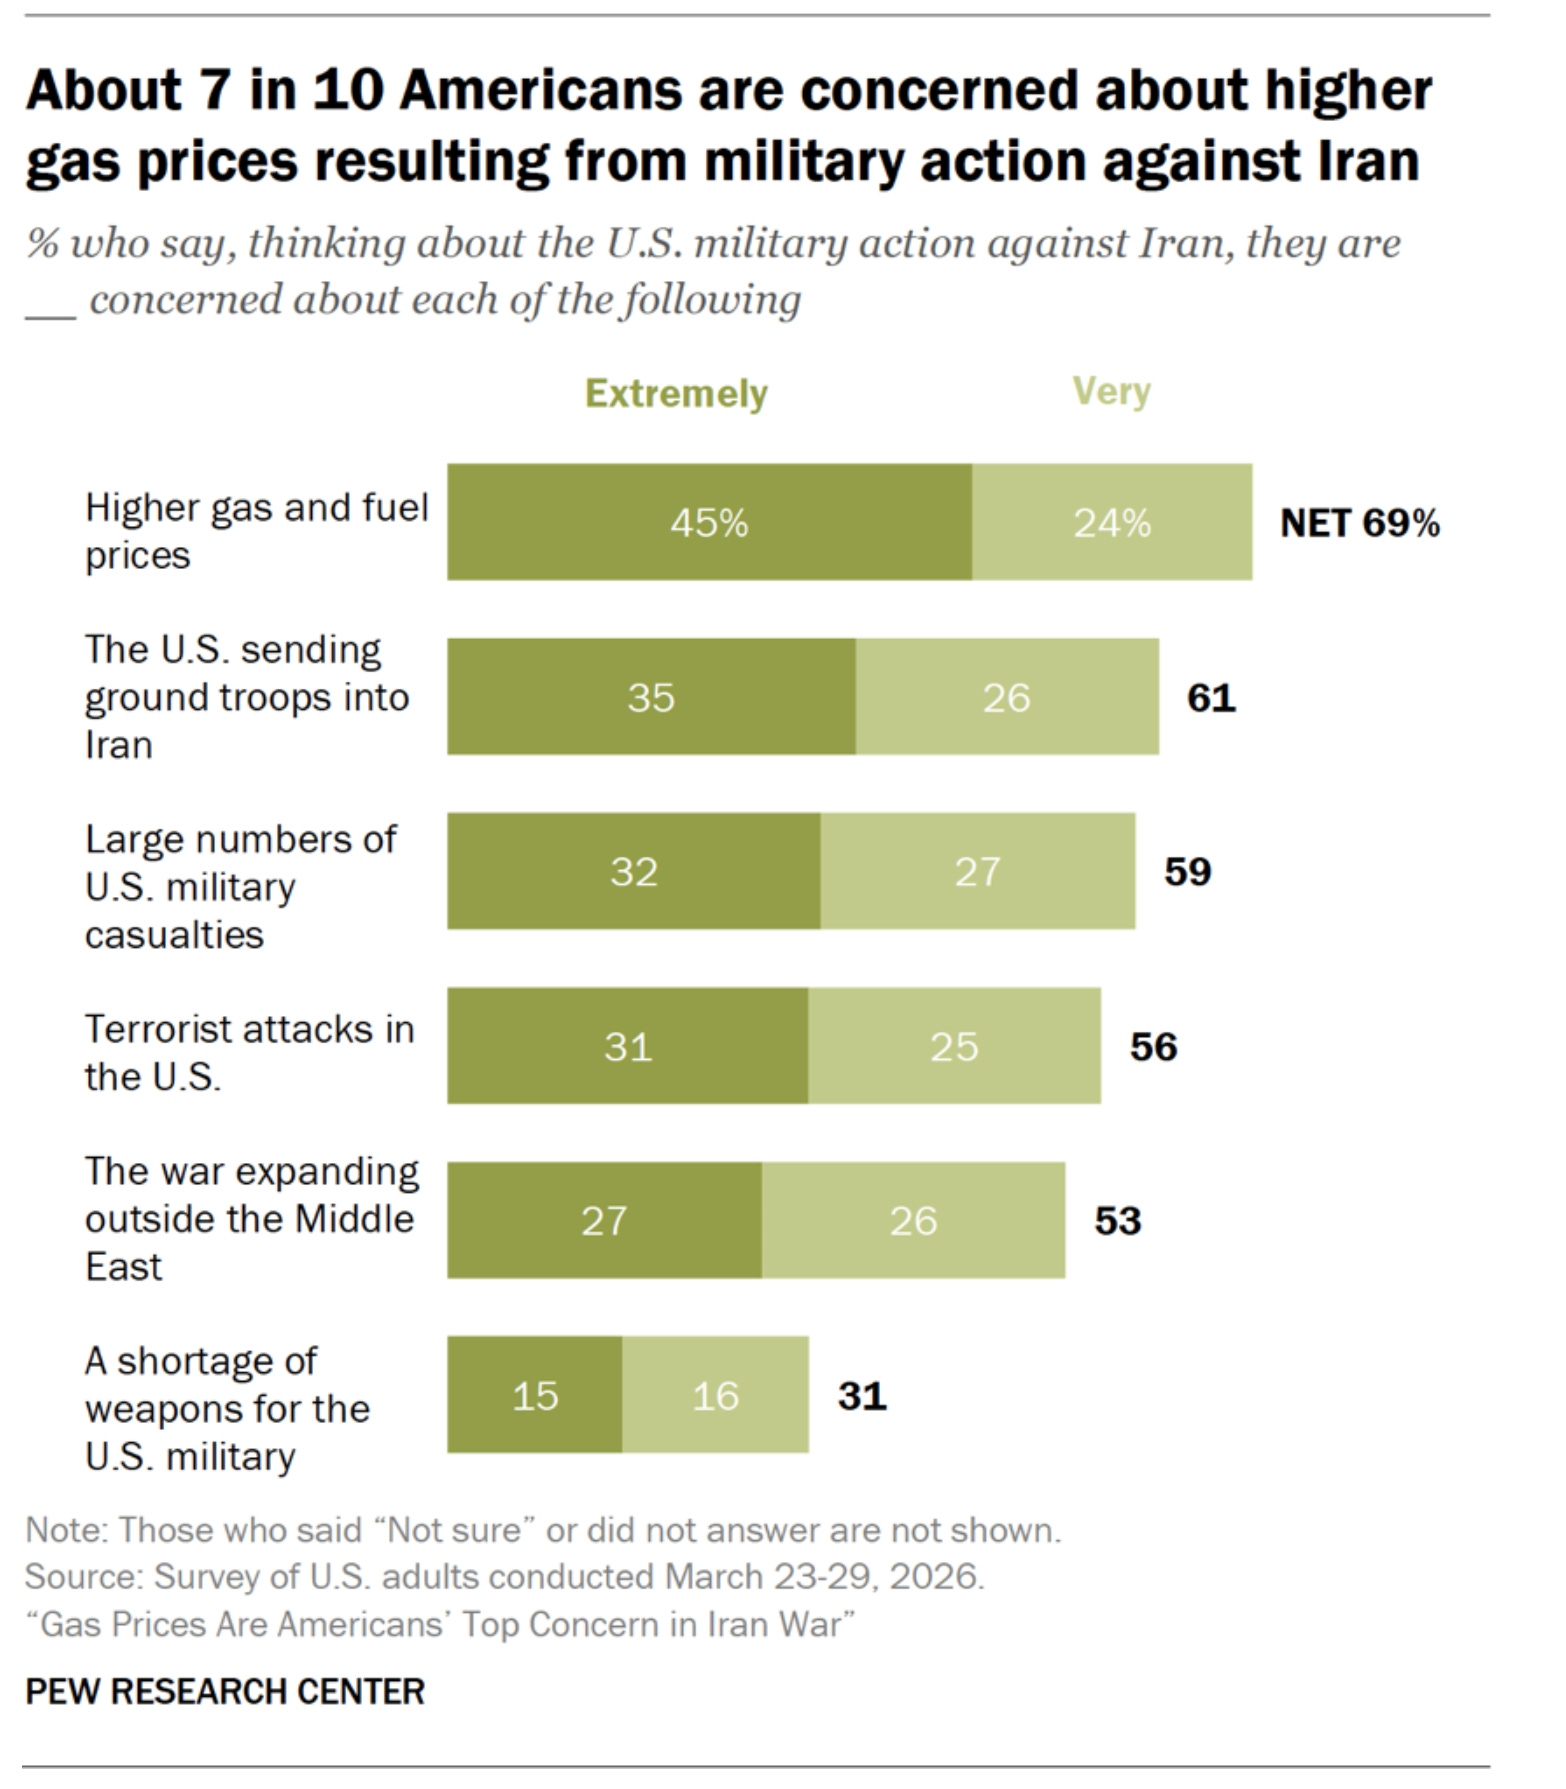
Figure 11. Americans Are Concerned About Higher Gasoline Prices:
The previous statistics added to the discontent of the people reflected in the polls data, betting markets suggest a democrat sweep win in the forthcoming midterm elections.
Figure 12. Democrats Are Set To Win The Senate On The Forthcoming Midterm Elections:
Source: Polymarket
Figure 13. Democrats Are Set To Win The House of Representatives On The Forthcoming Midterm Elections:
Source: Polymarket
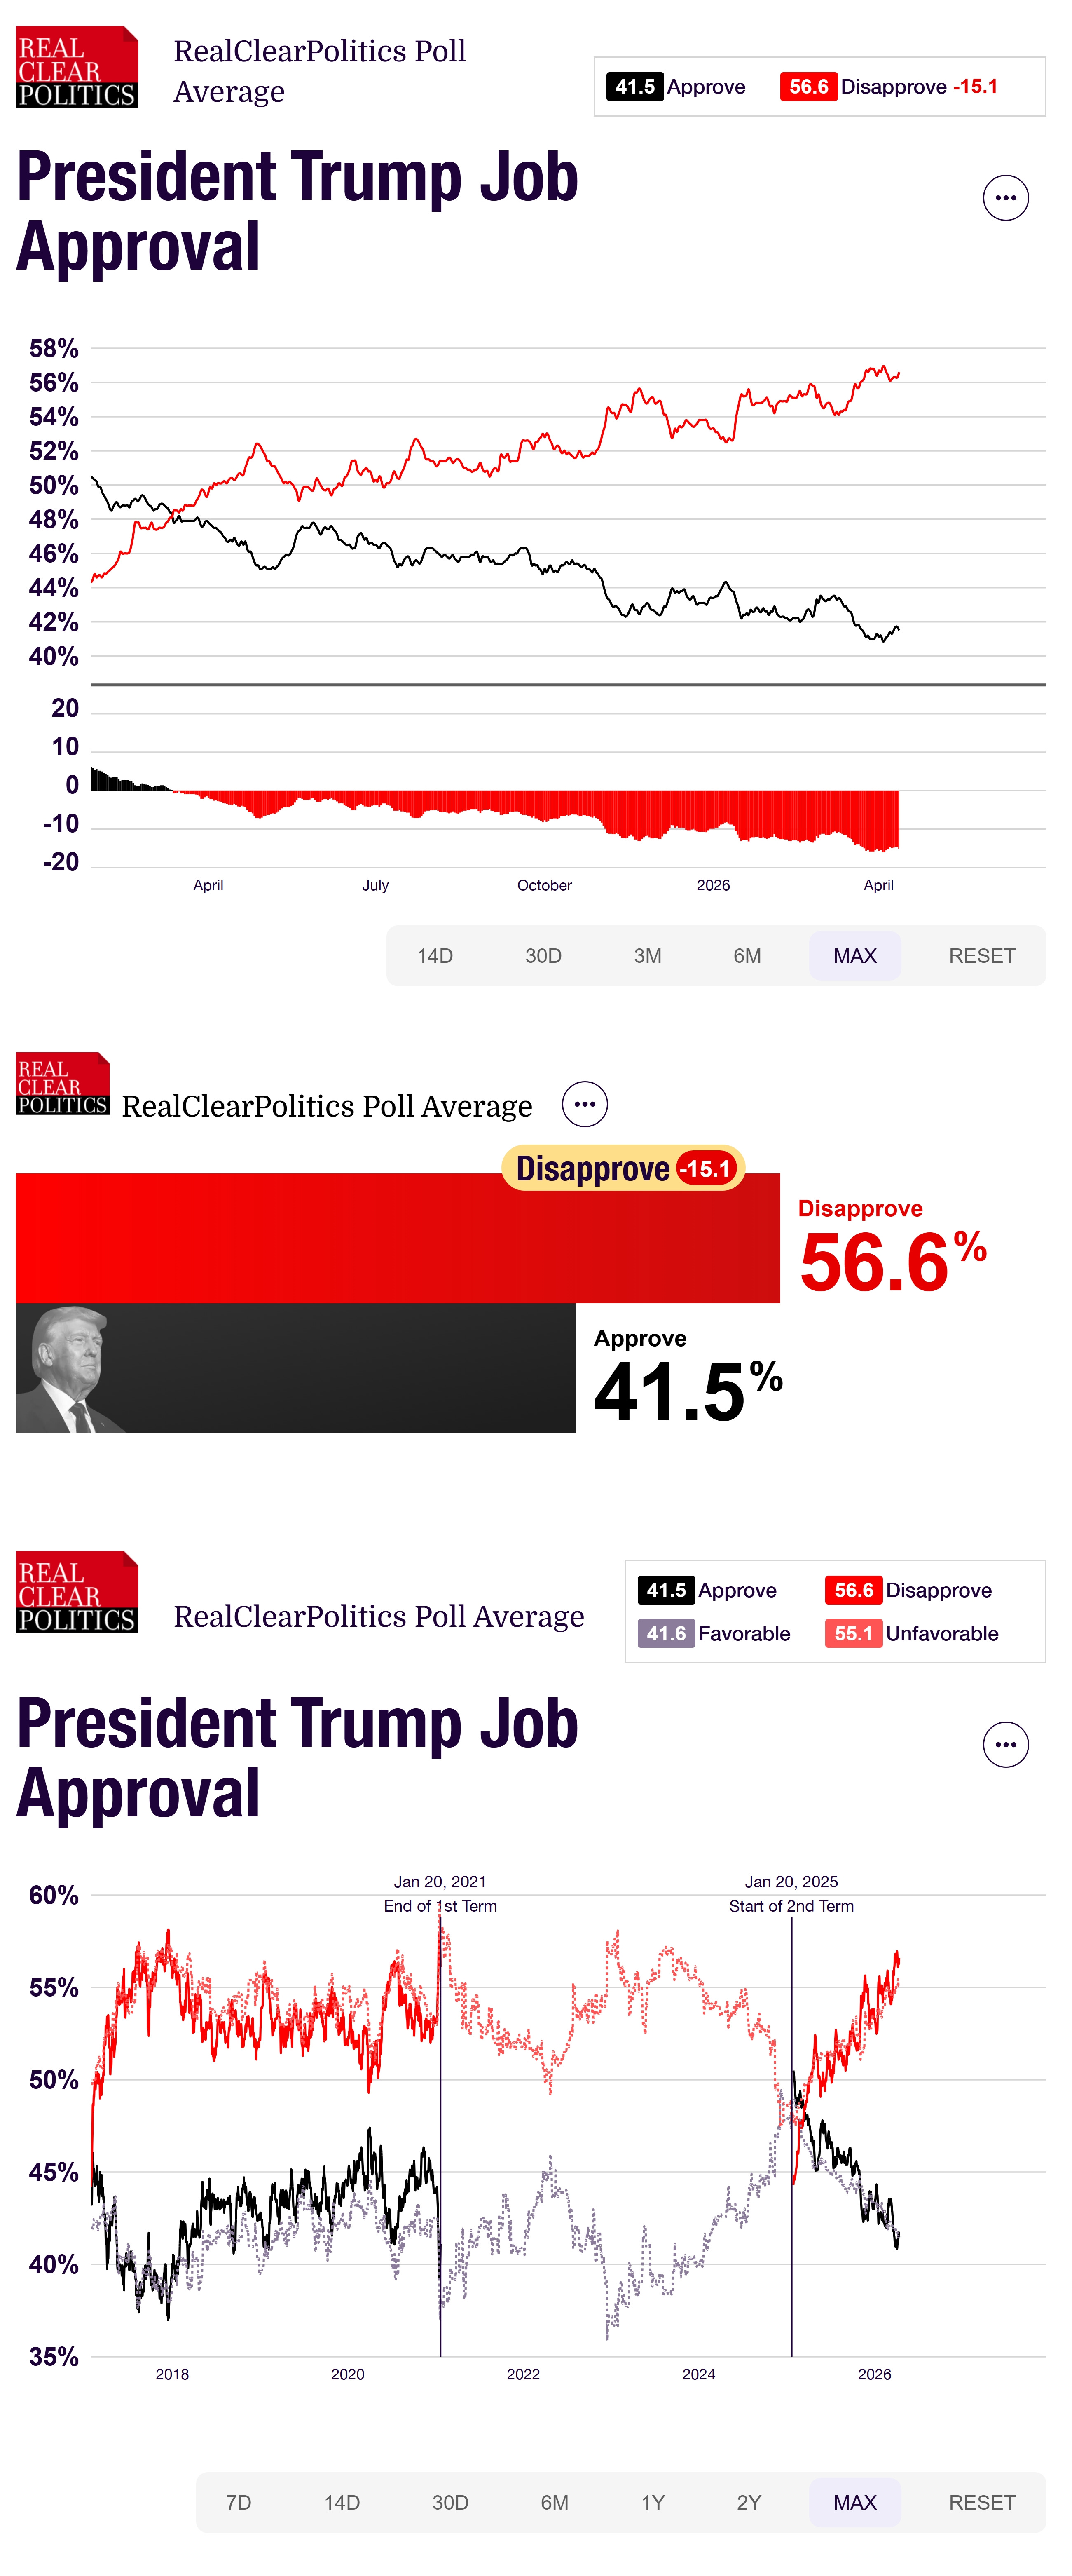
Figure 14. President Trump Faces Low Approval Rating:

I highly recommend to read this article over the oil market implications:

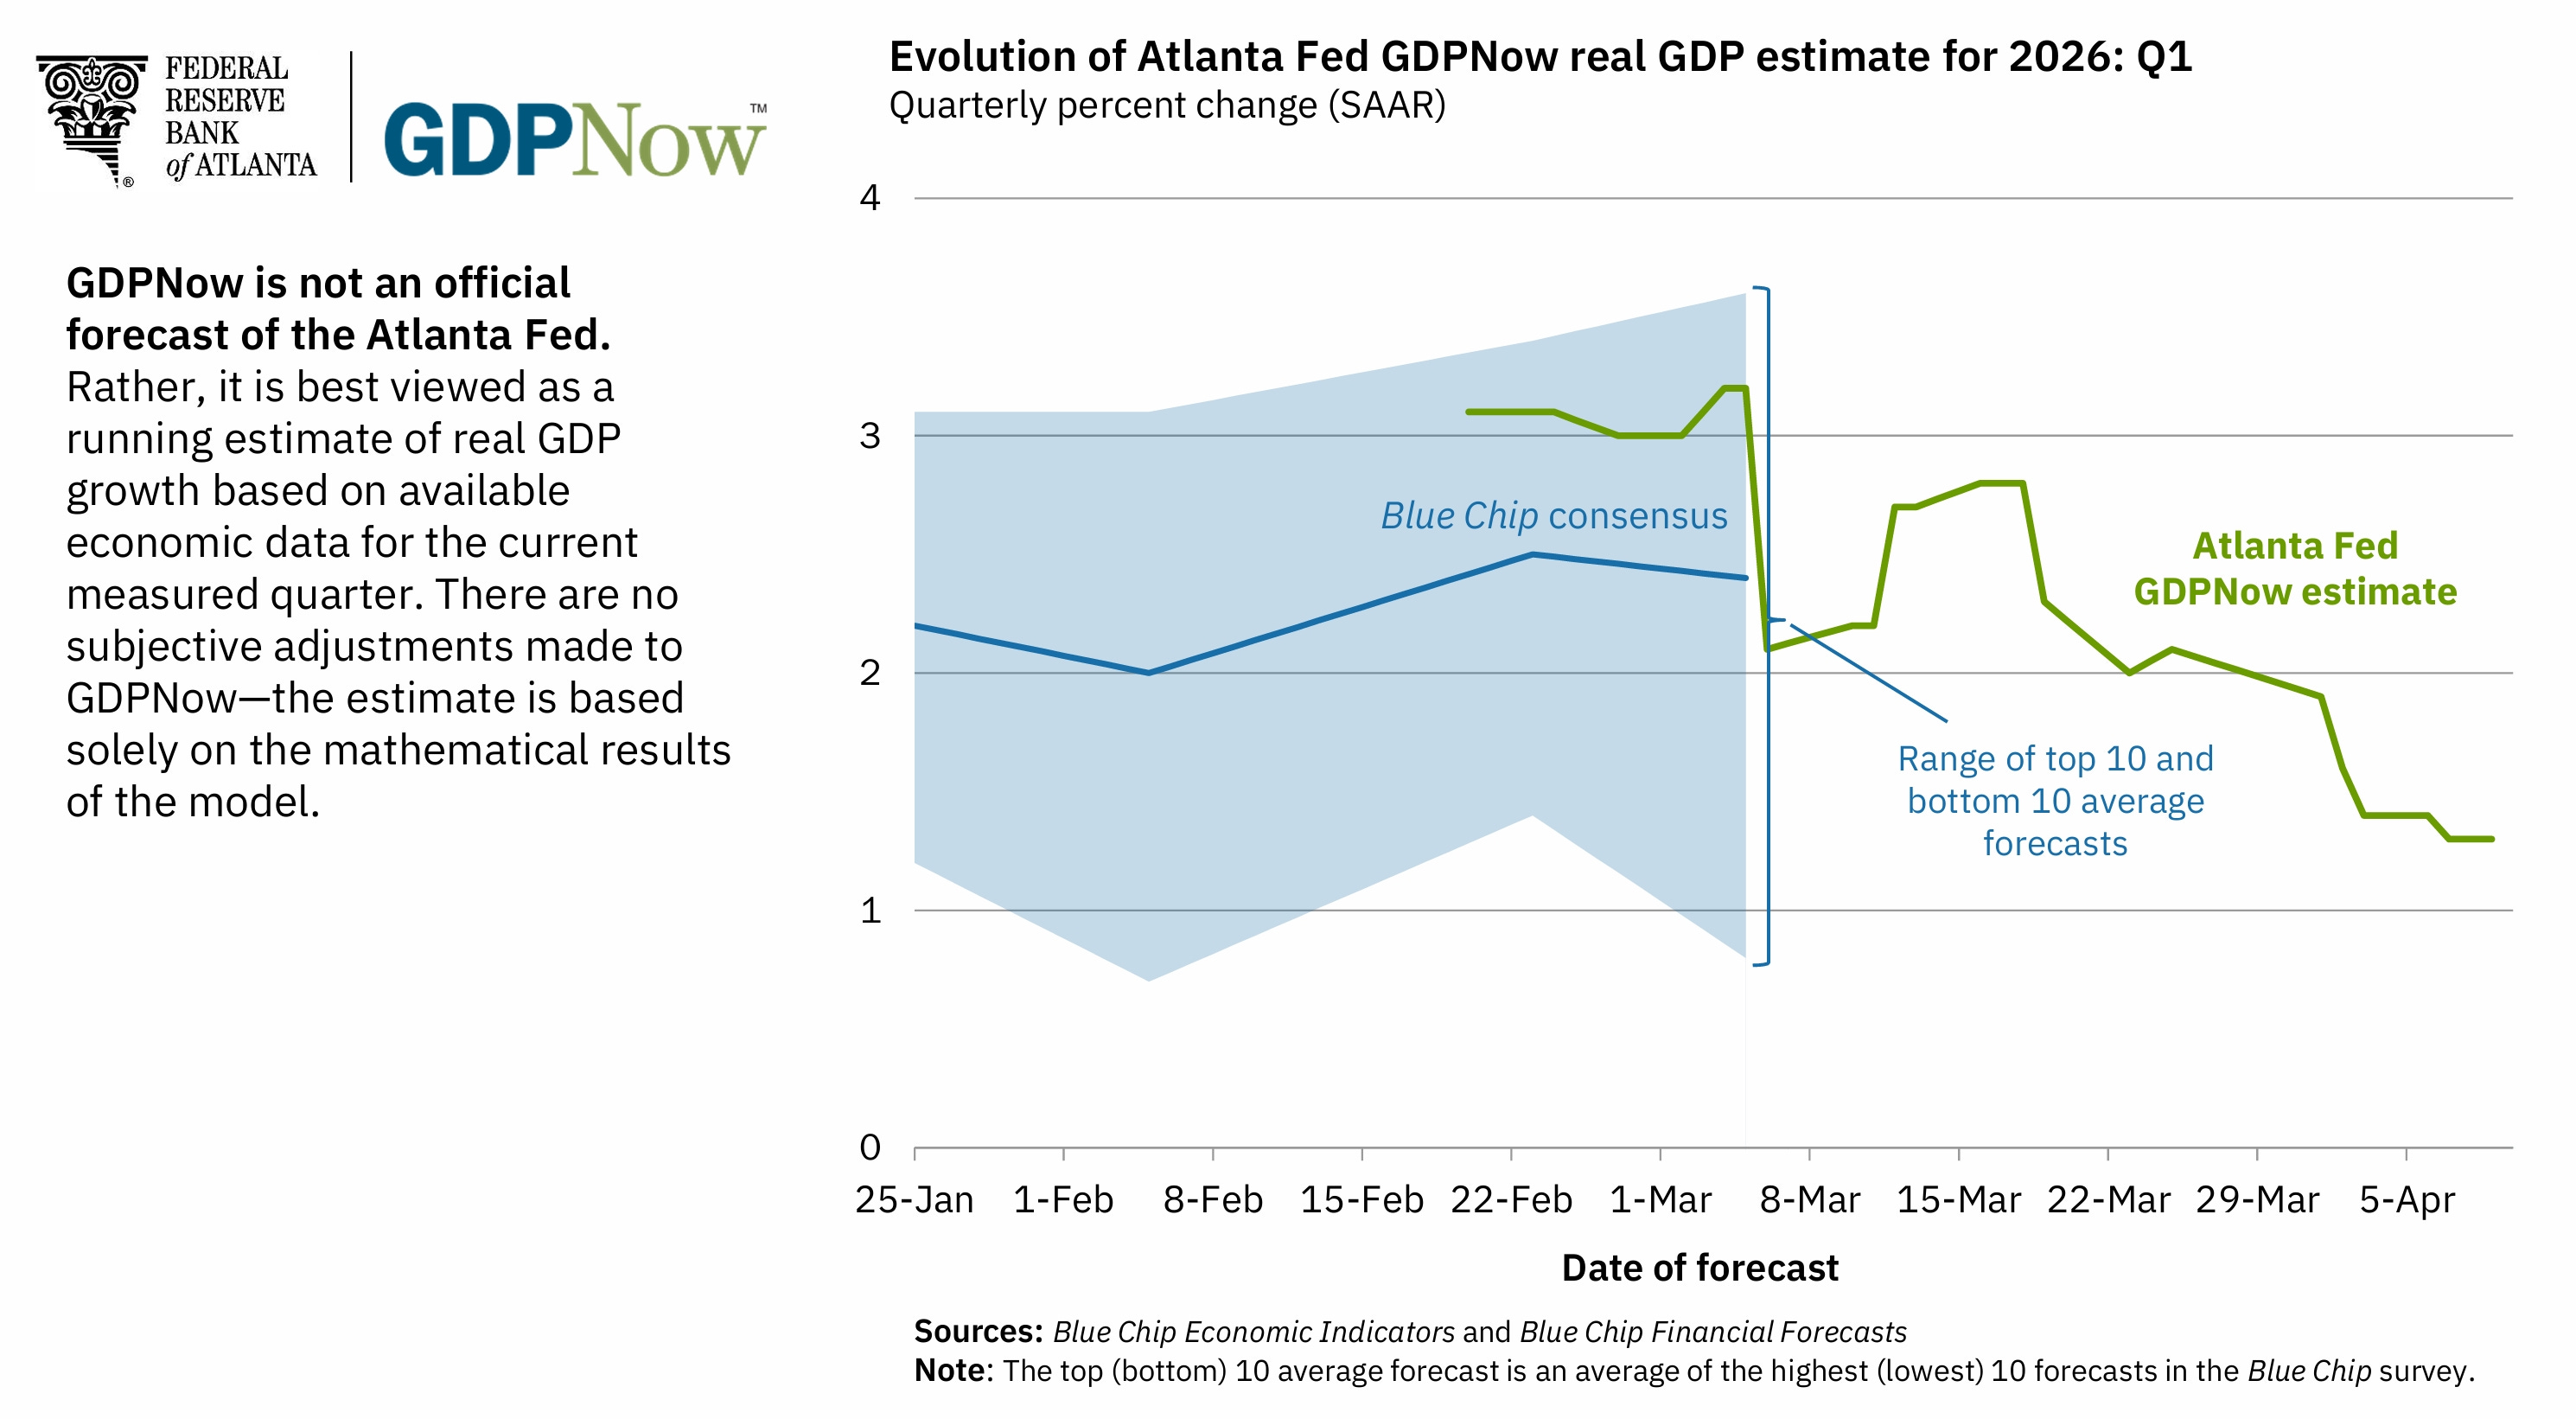
Geopolitical factors will likely keep oil risk premia elevated; higher oil prices will likely put pressure on GDP growth, but prospects remain stable, for now.
Figure 15. Atlanta Fed’s GDPNow Forecast:
﹌﹌﹌﹌﹌﹌﹌﹌﹌﹌﹌﹌﹌﹌﹌﹌﹌﹌﹌﹌﹌﹌﹌﹌﹌﹌﹌﹌﹌﹌﹌﹌﹌﹌﹌﹌﹌﹌﹌﹌﹌﹌﹌﹌﹌﹌﹌﹌﹌﹌﹌﹌﹌﹌﹌﹌﹌﹌﹌﹌﹌﹌﹌﹌﹌﹌﹌﹌﹌﹌﹌﹌
Stagflation in the UK:
The United Kingdom’s economy is facing stagflation, plausible changes in the government’s tax system may boost growth, but there are clear sings of deterioration in the British workforce, the inflation risk outweights the labor market data, with UK firms rising inflation expectations, the Bank of England’s Monetary Policy Members must maintain a hawkish-nimble stance.
Figure 16. UK Firms Lift Inflation Expectations:
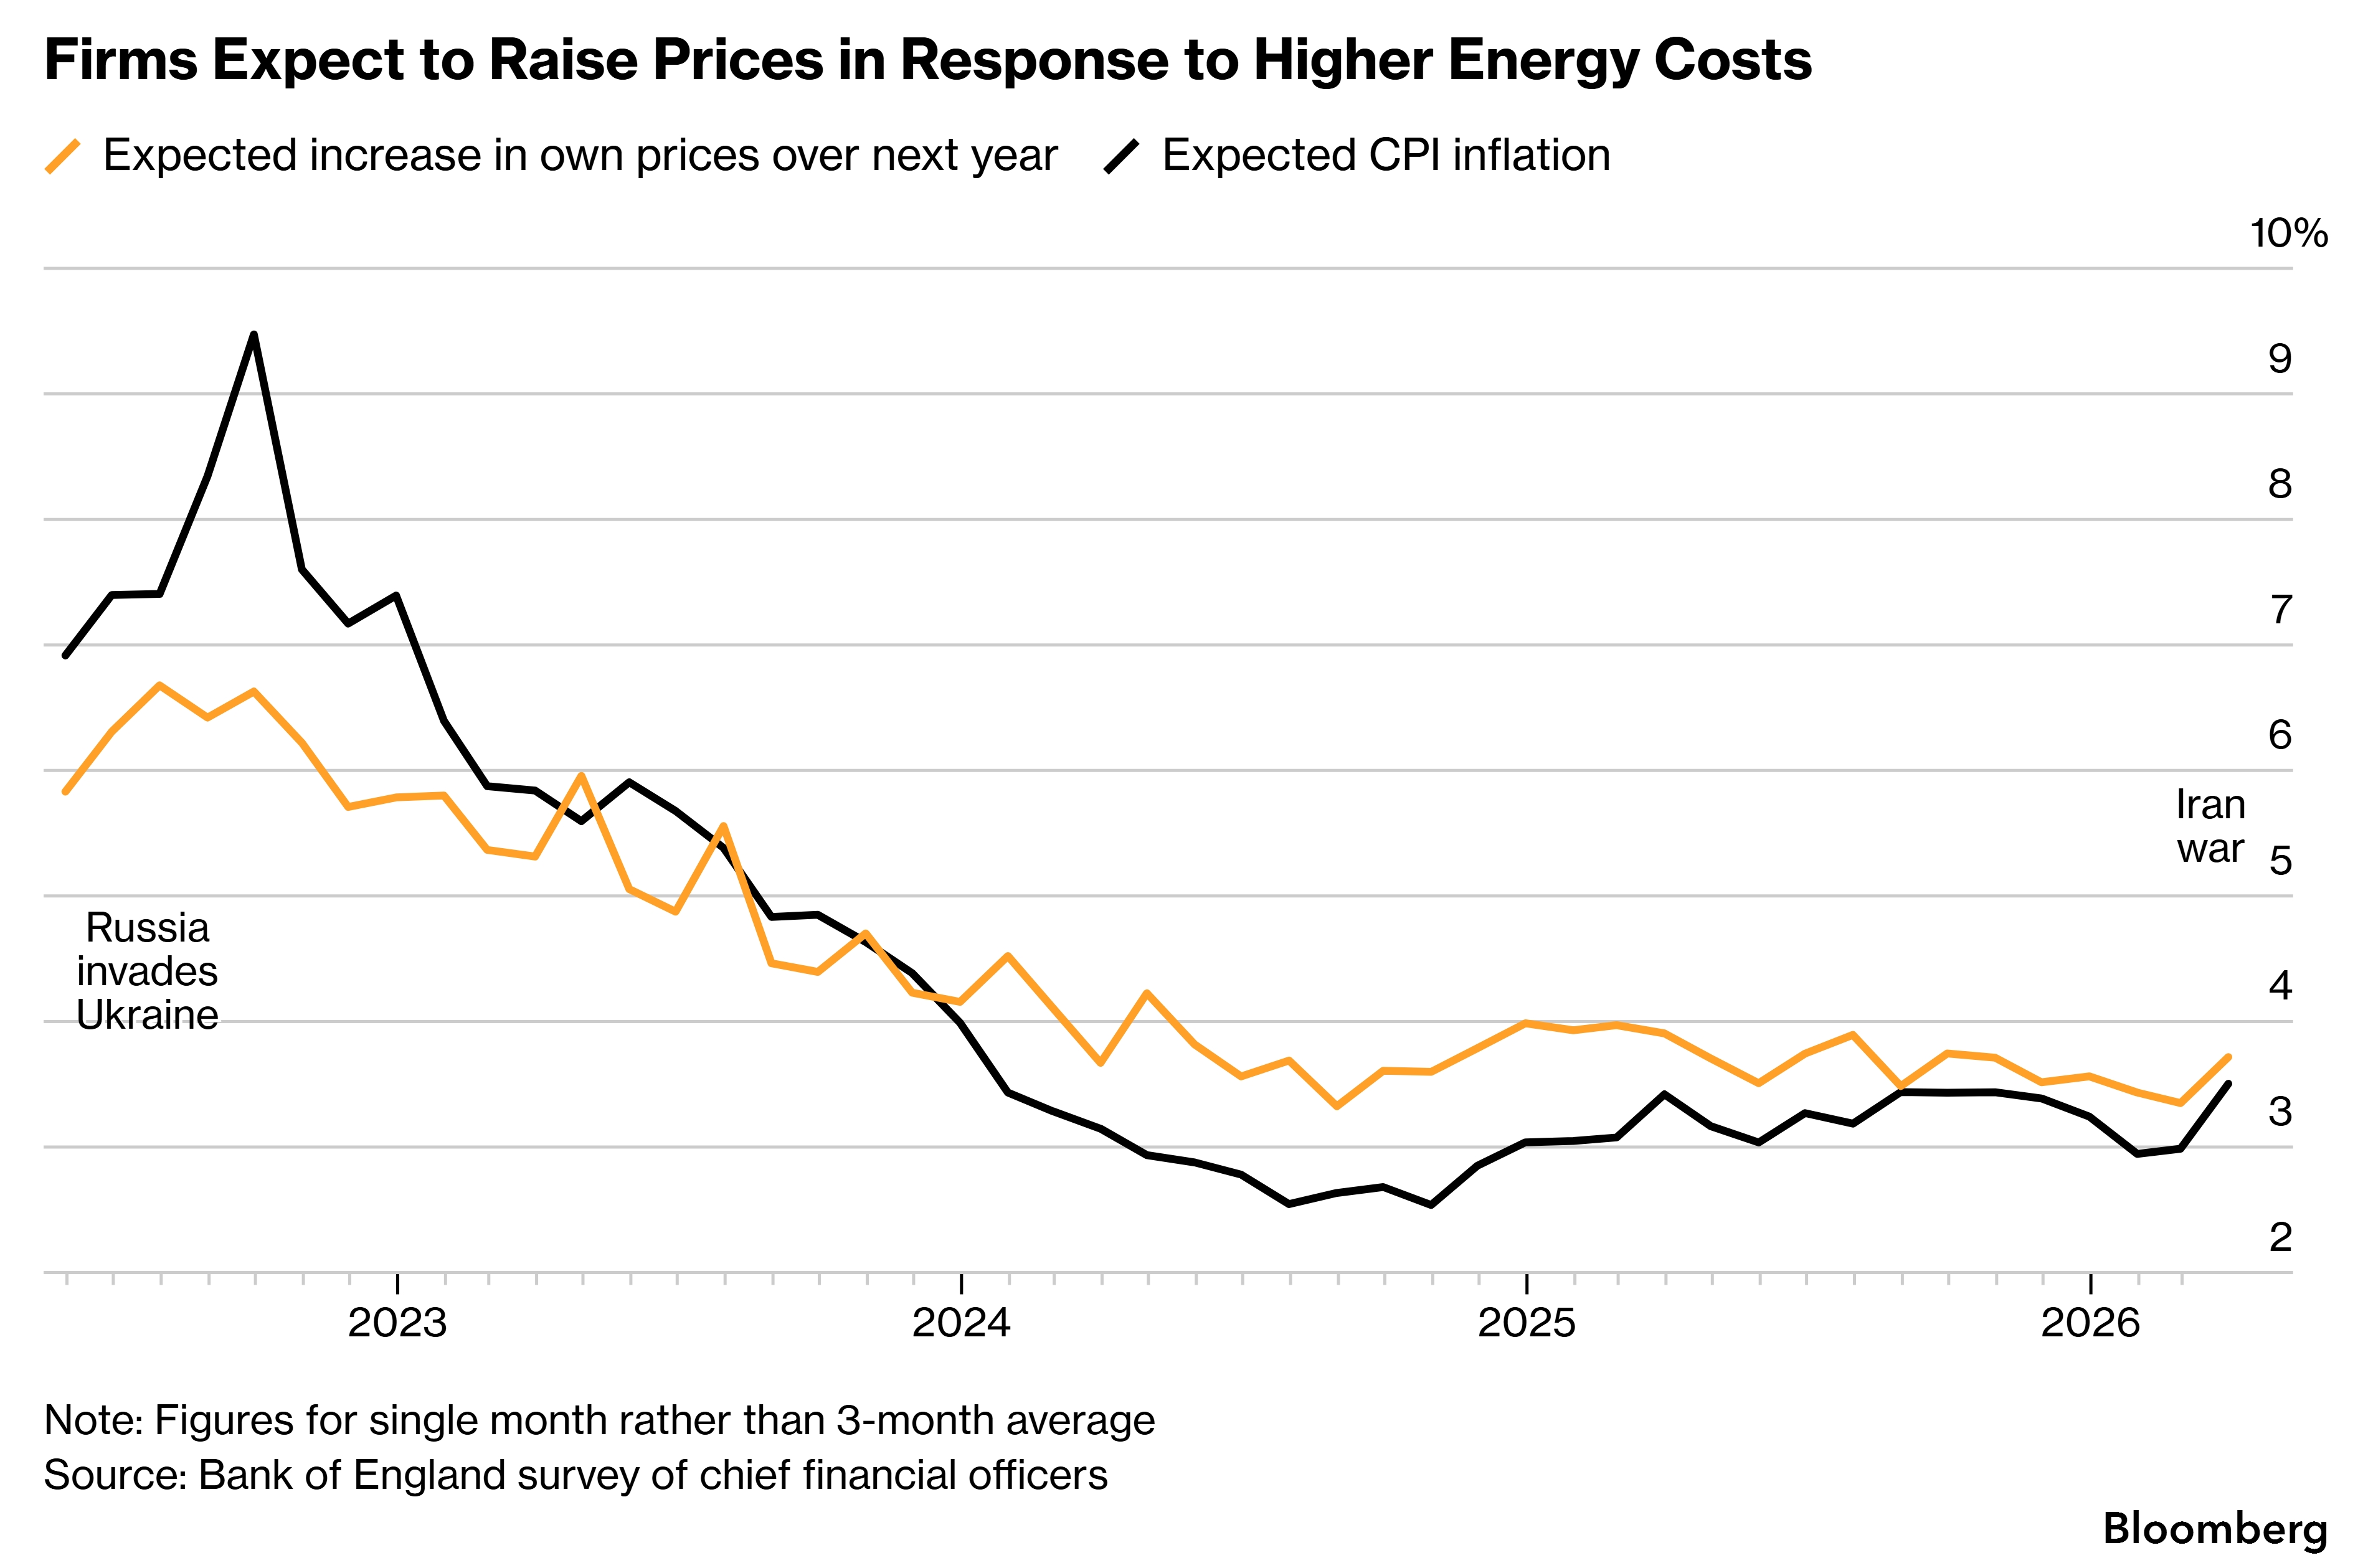
Figure 17. Modest GDP Growth In The United Kingdom.
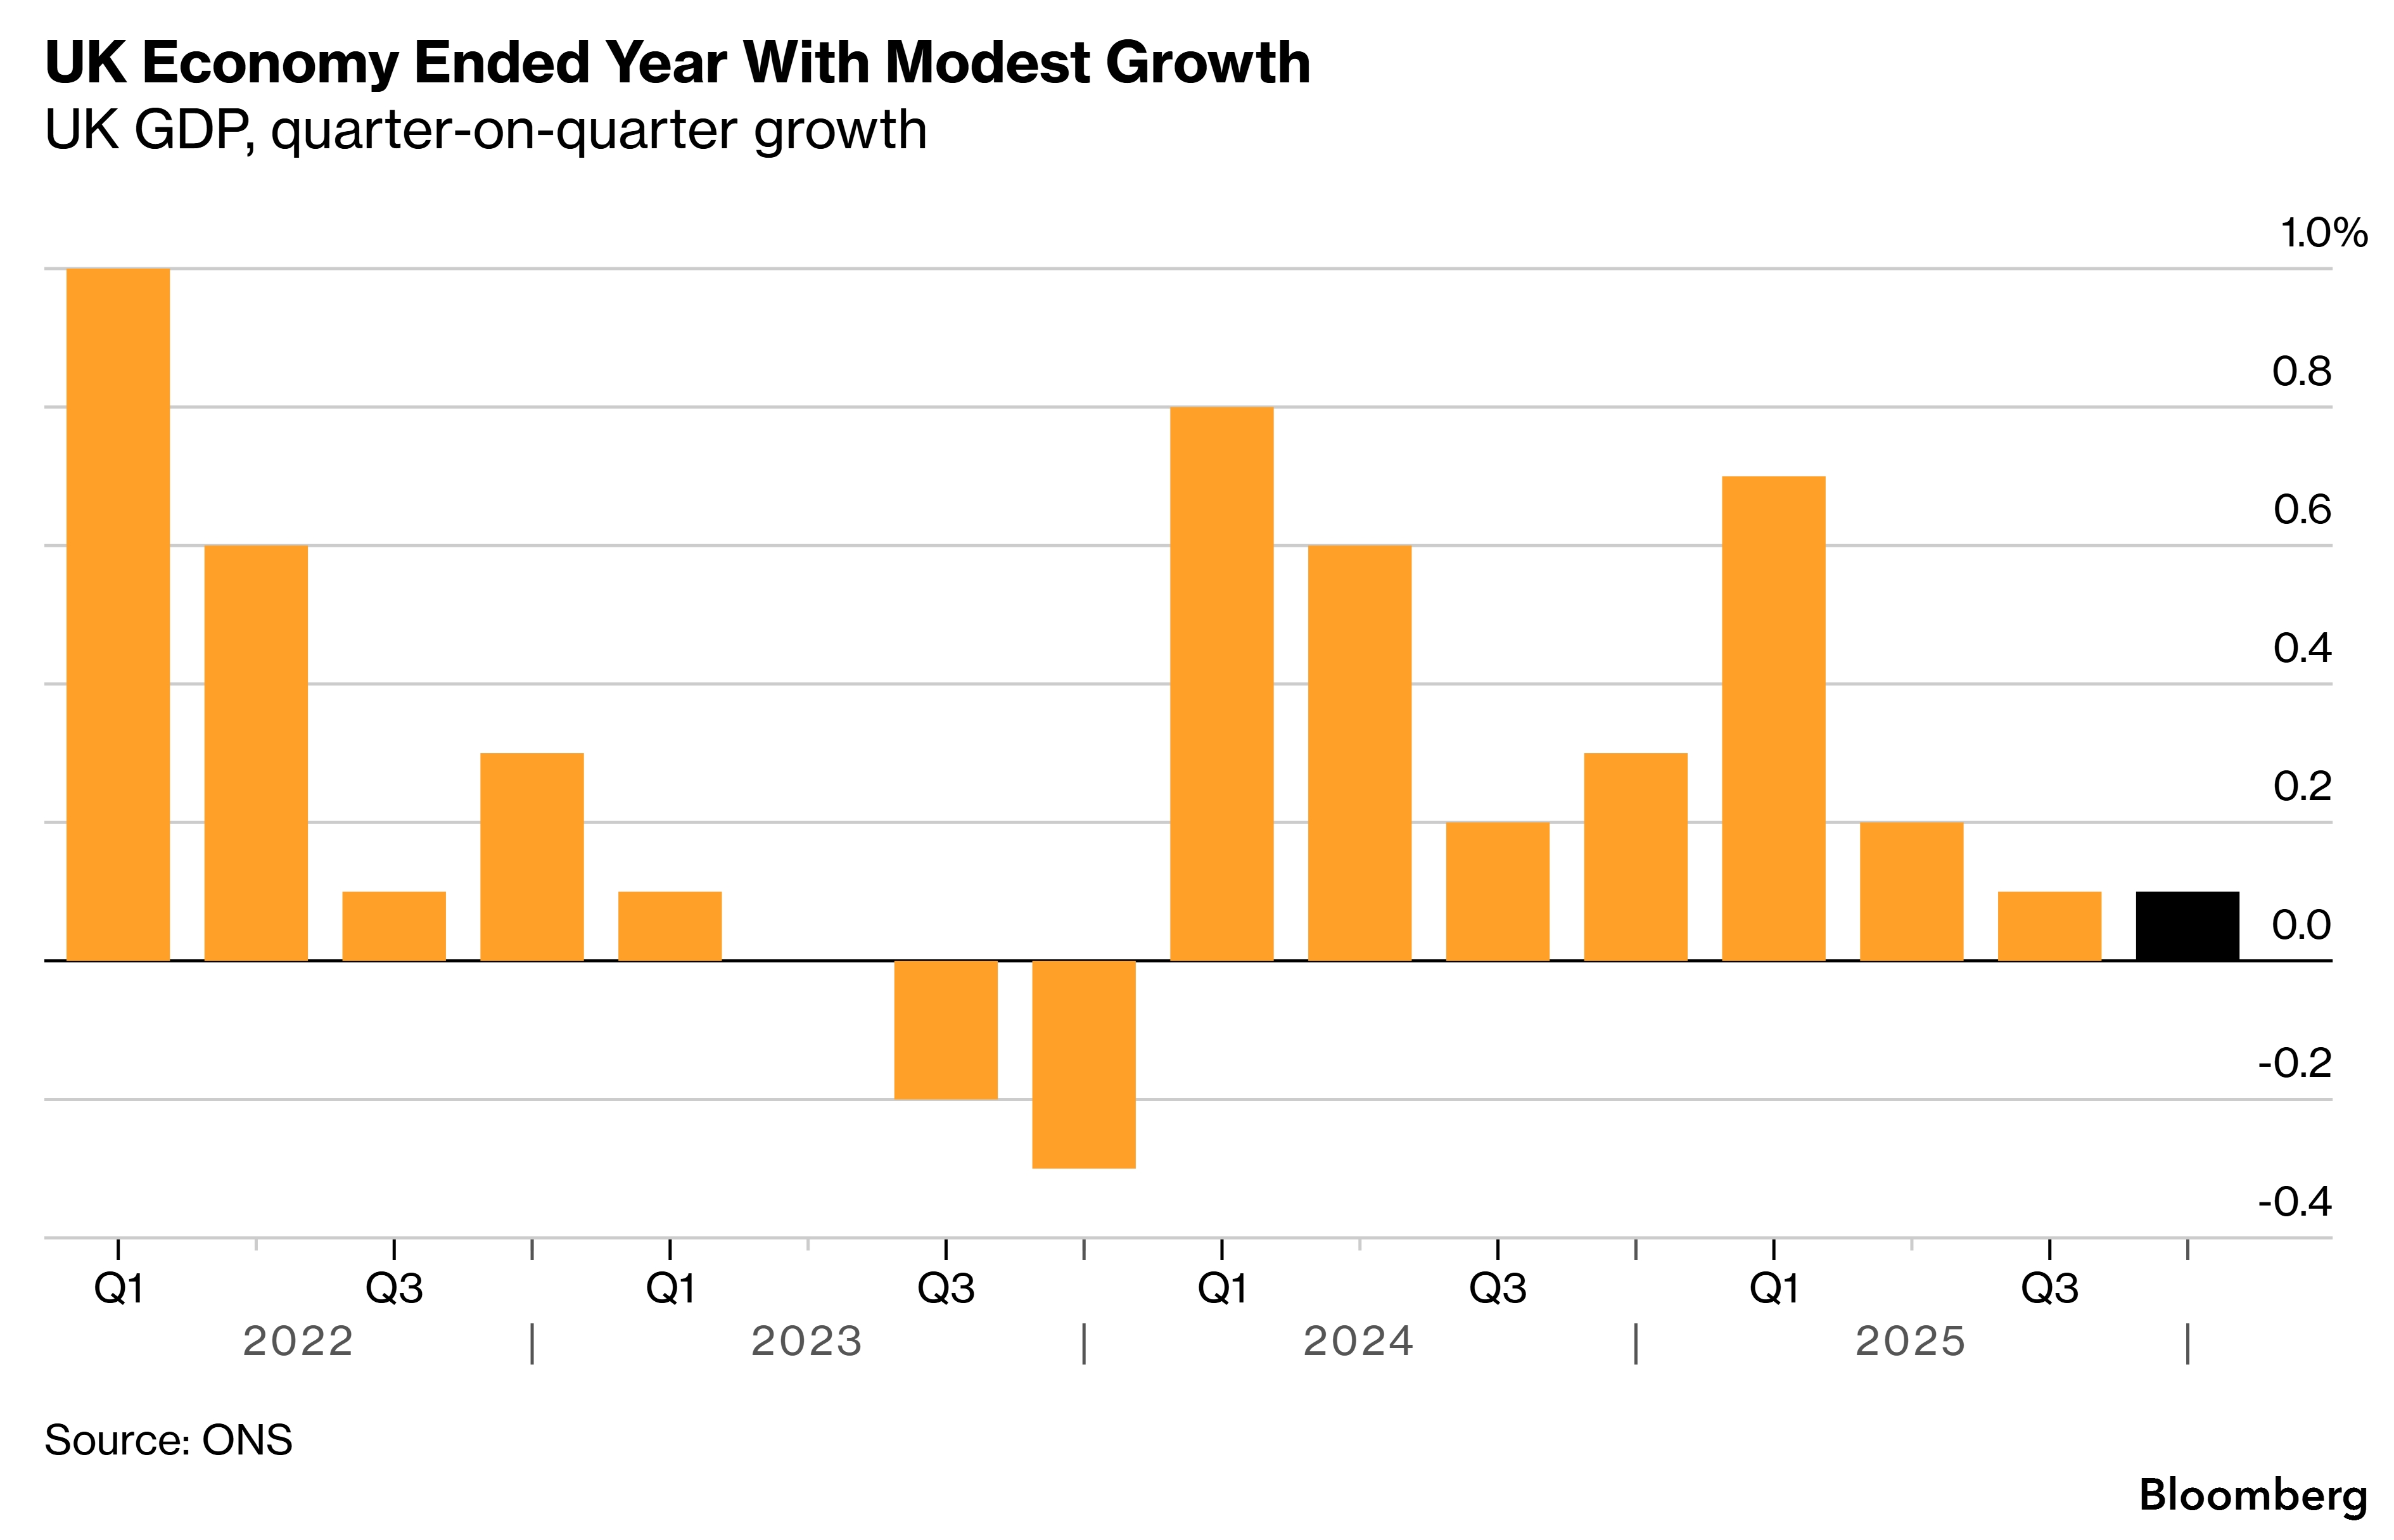
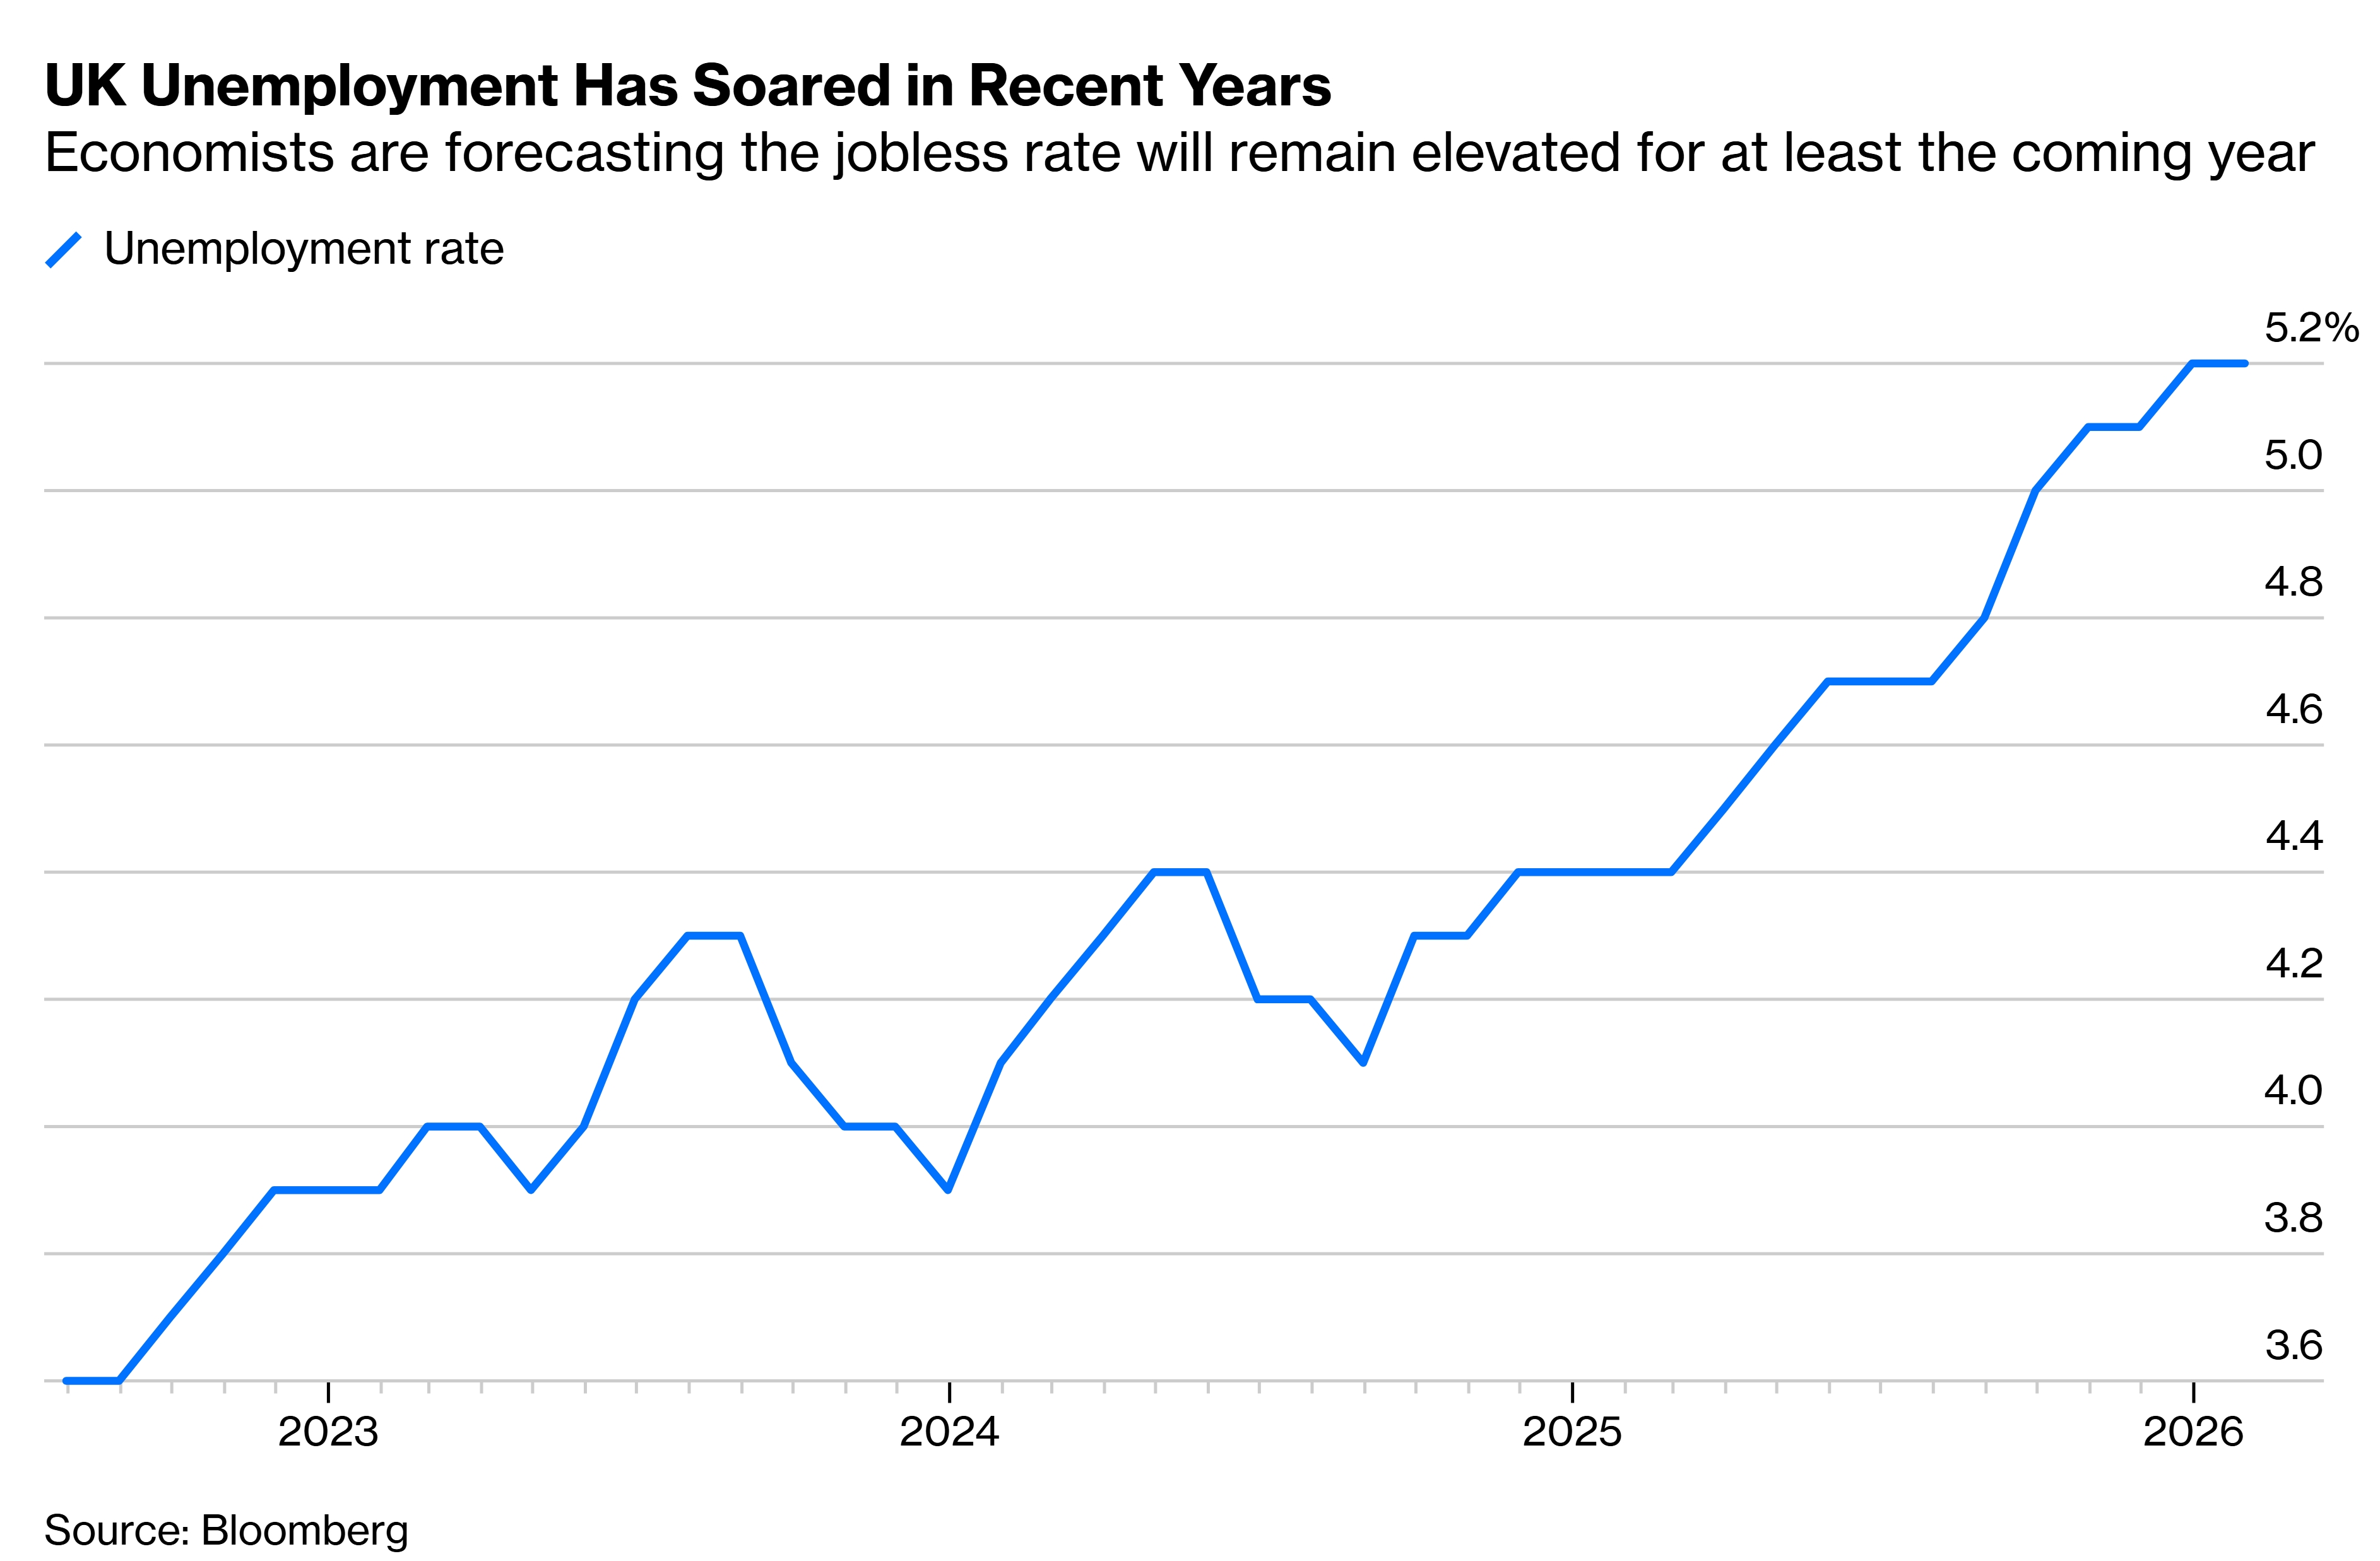
Figure 18. Lackluster Job Market Growth Reflected In The Increased And Increasing Unemployment Rate.
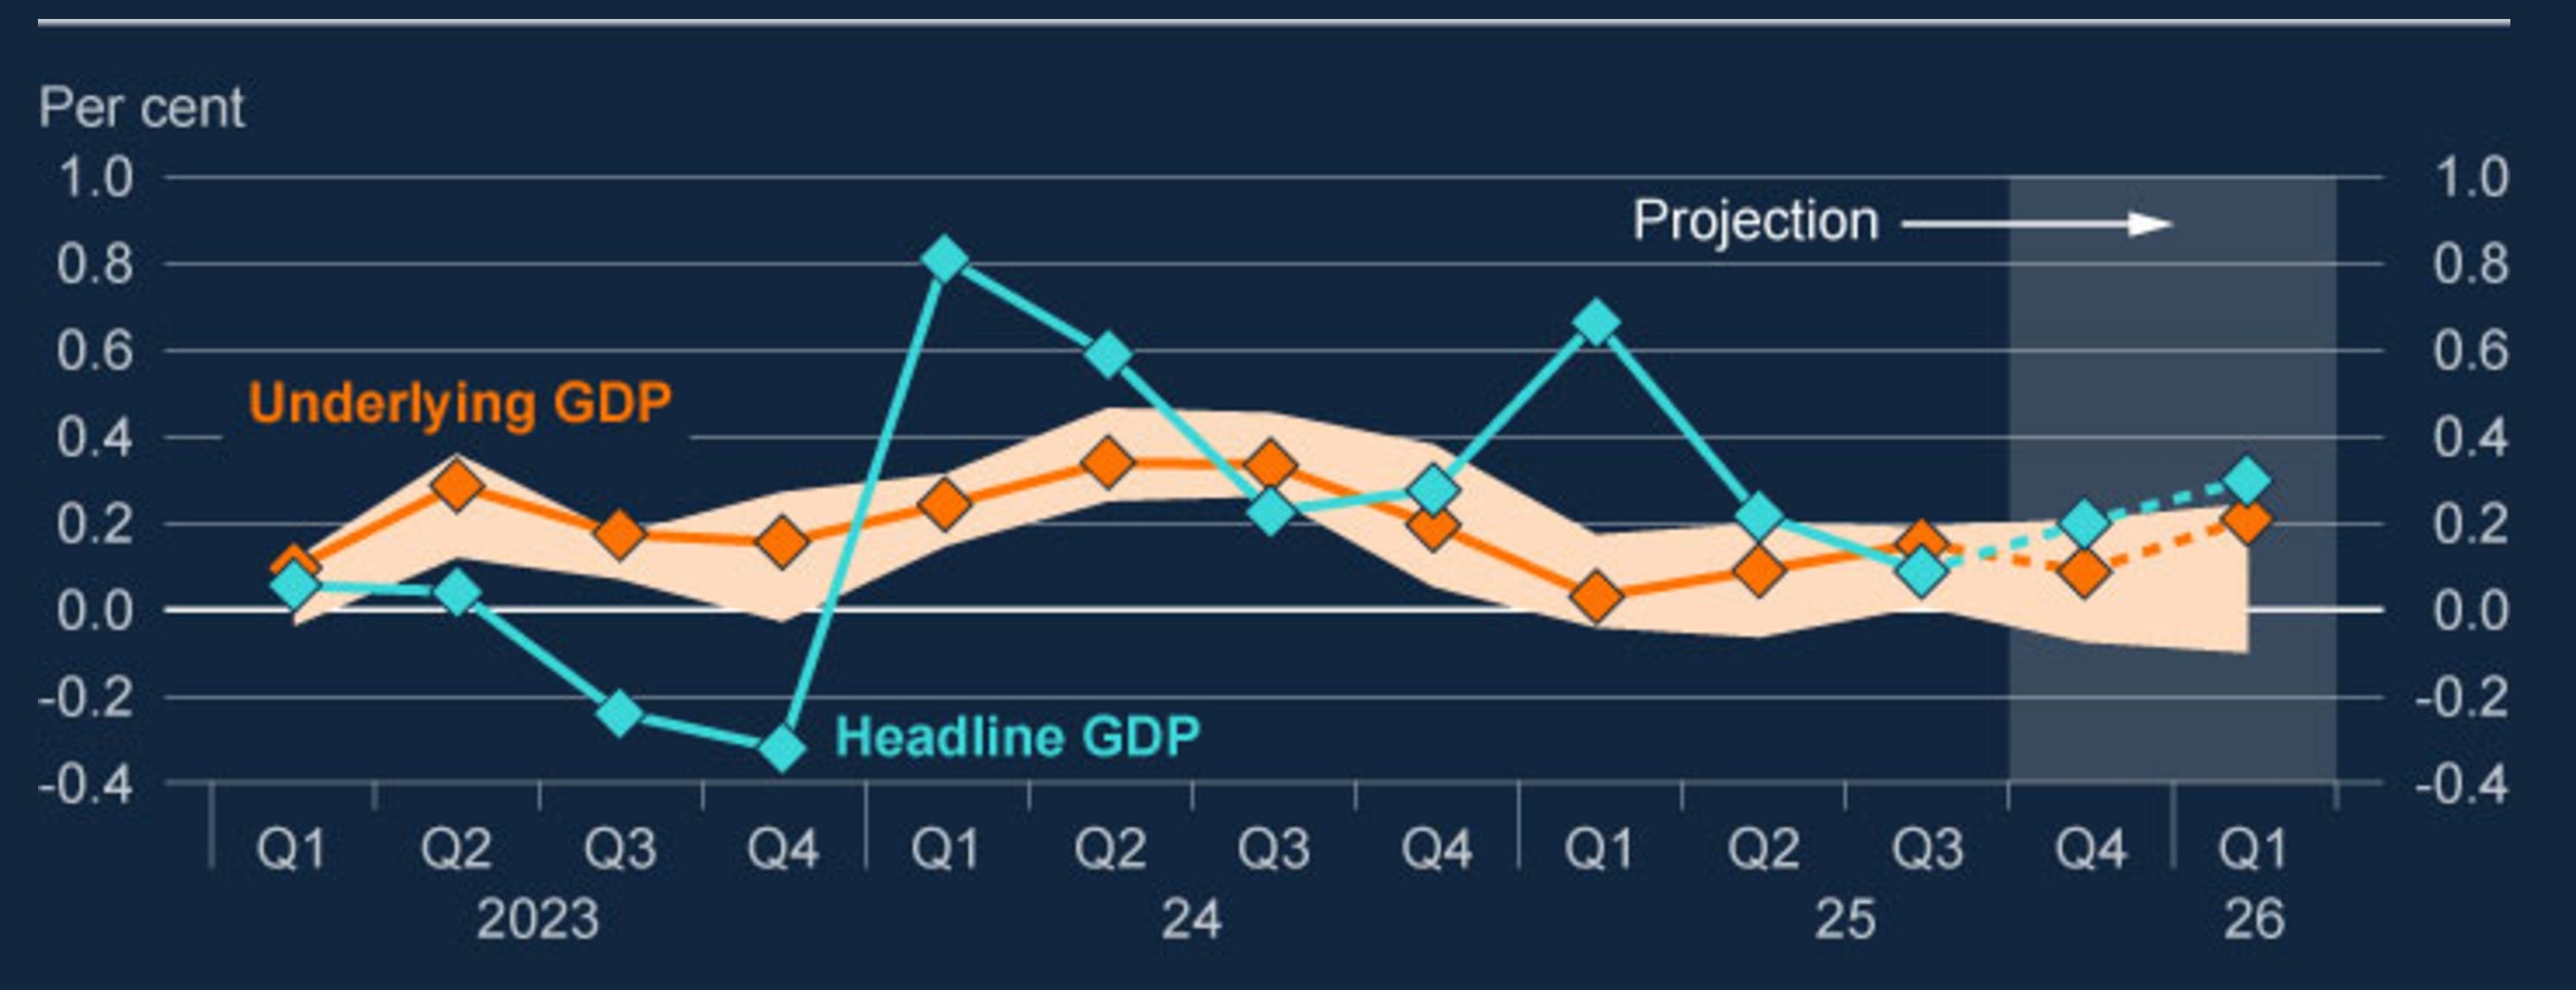
All of this means that there has to be one of two: rate hikes to ward off inflation or tax cuts to boost growth; the Bank of England projected higher GDP growth.
Figure 19. Higher GDP Growth Projected For The United Kingdom.
Thus far the main beneficiaries of the current oil supply shock in the British stock market is the oil sector, which British Petroleum (BP) plc stock BP 0.00%↑ benefits from it. I expect British Petroleum (BP) plc BP 0.00%↑ to beat earnings given the rising gasoil and oil prices.
﹌﹌﹌﹌﹌﹌﹌﹌﹌﹌﹌﹌﹌﹌﹌﹌﹌﹌﹌﹌﹌﹌﹌﹌﹌﹌﹌﹌﹌﹌﹌﹌﹌﹌﹌﹌﹌﹌﹌﹌﹌﹌﹌﹌﹌﹌﹌﹌﹌﹌﹌﹌﹌﹌﹌﹌﹌﹌﹌﹌﹌﹌﹌﹌﹌﹌﹌﹌﹌﹌﹌﹌
Strong Europe:
The Euro Area is benefiting from the Iran war, European exceptionalism marked under the respect of the international law granted European nations the pre Iran war status-quo that Europe had and even better diplomatic ties with BRICS. The United States is isolating itself from the world to the point that it might leave NATO. Since the tariffs war with China, Europeans have hedged the move through the VLCC futures market, the Iran war has increased the term premia in the sector, ticker of interest is BWET 0.00%↑.
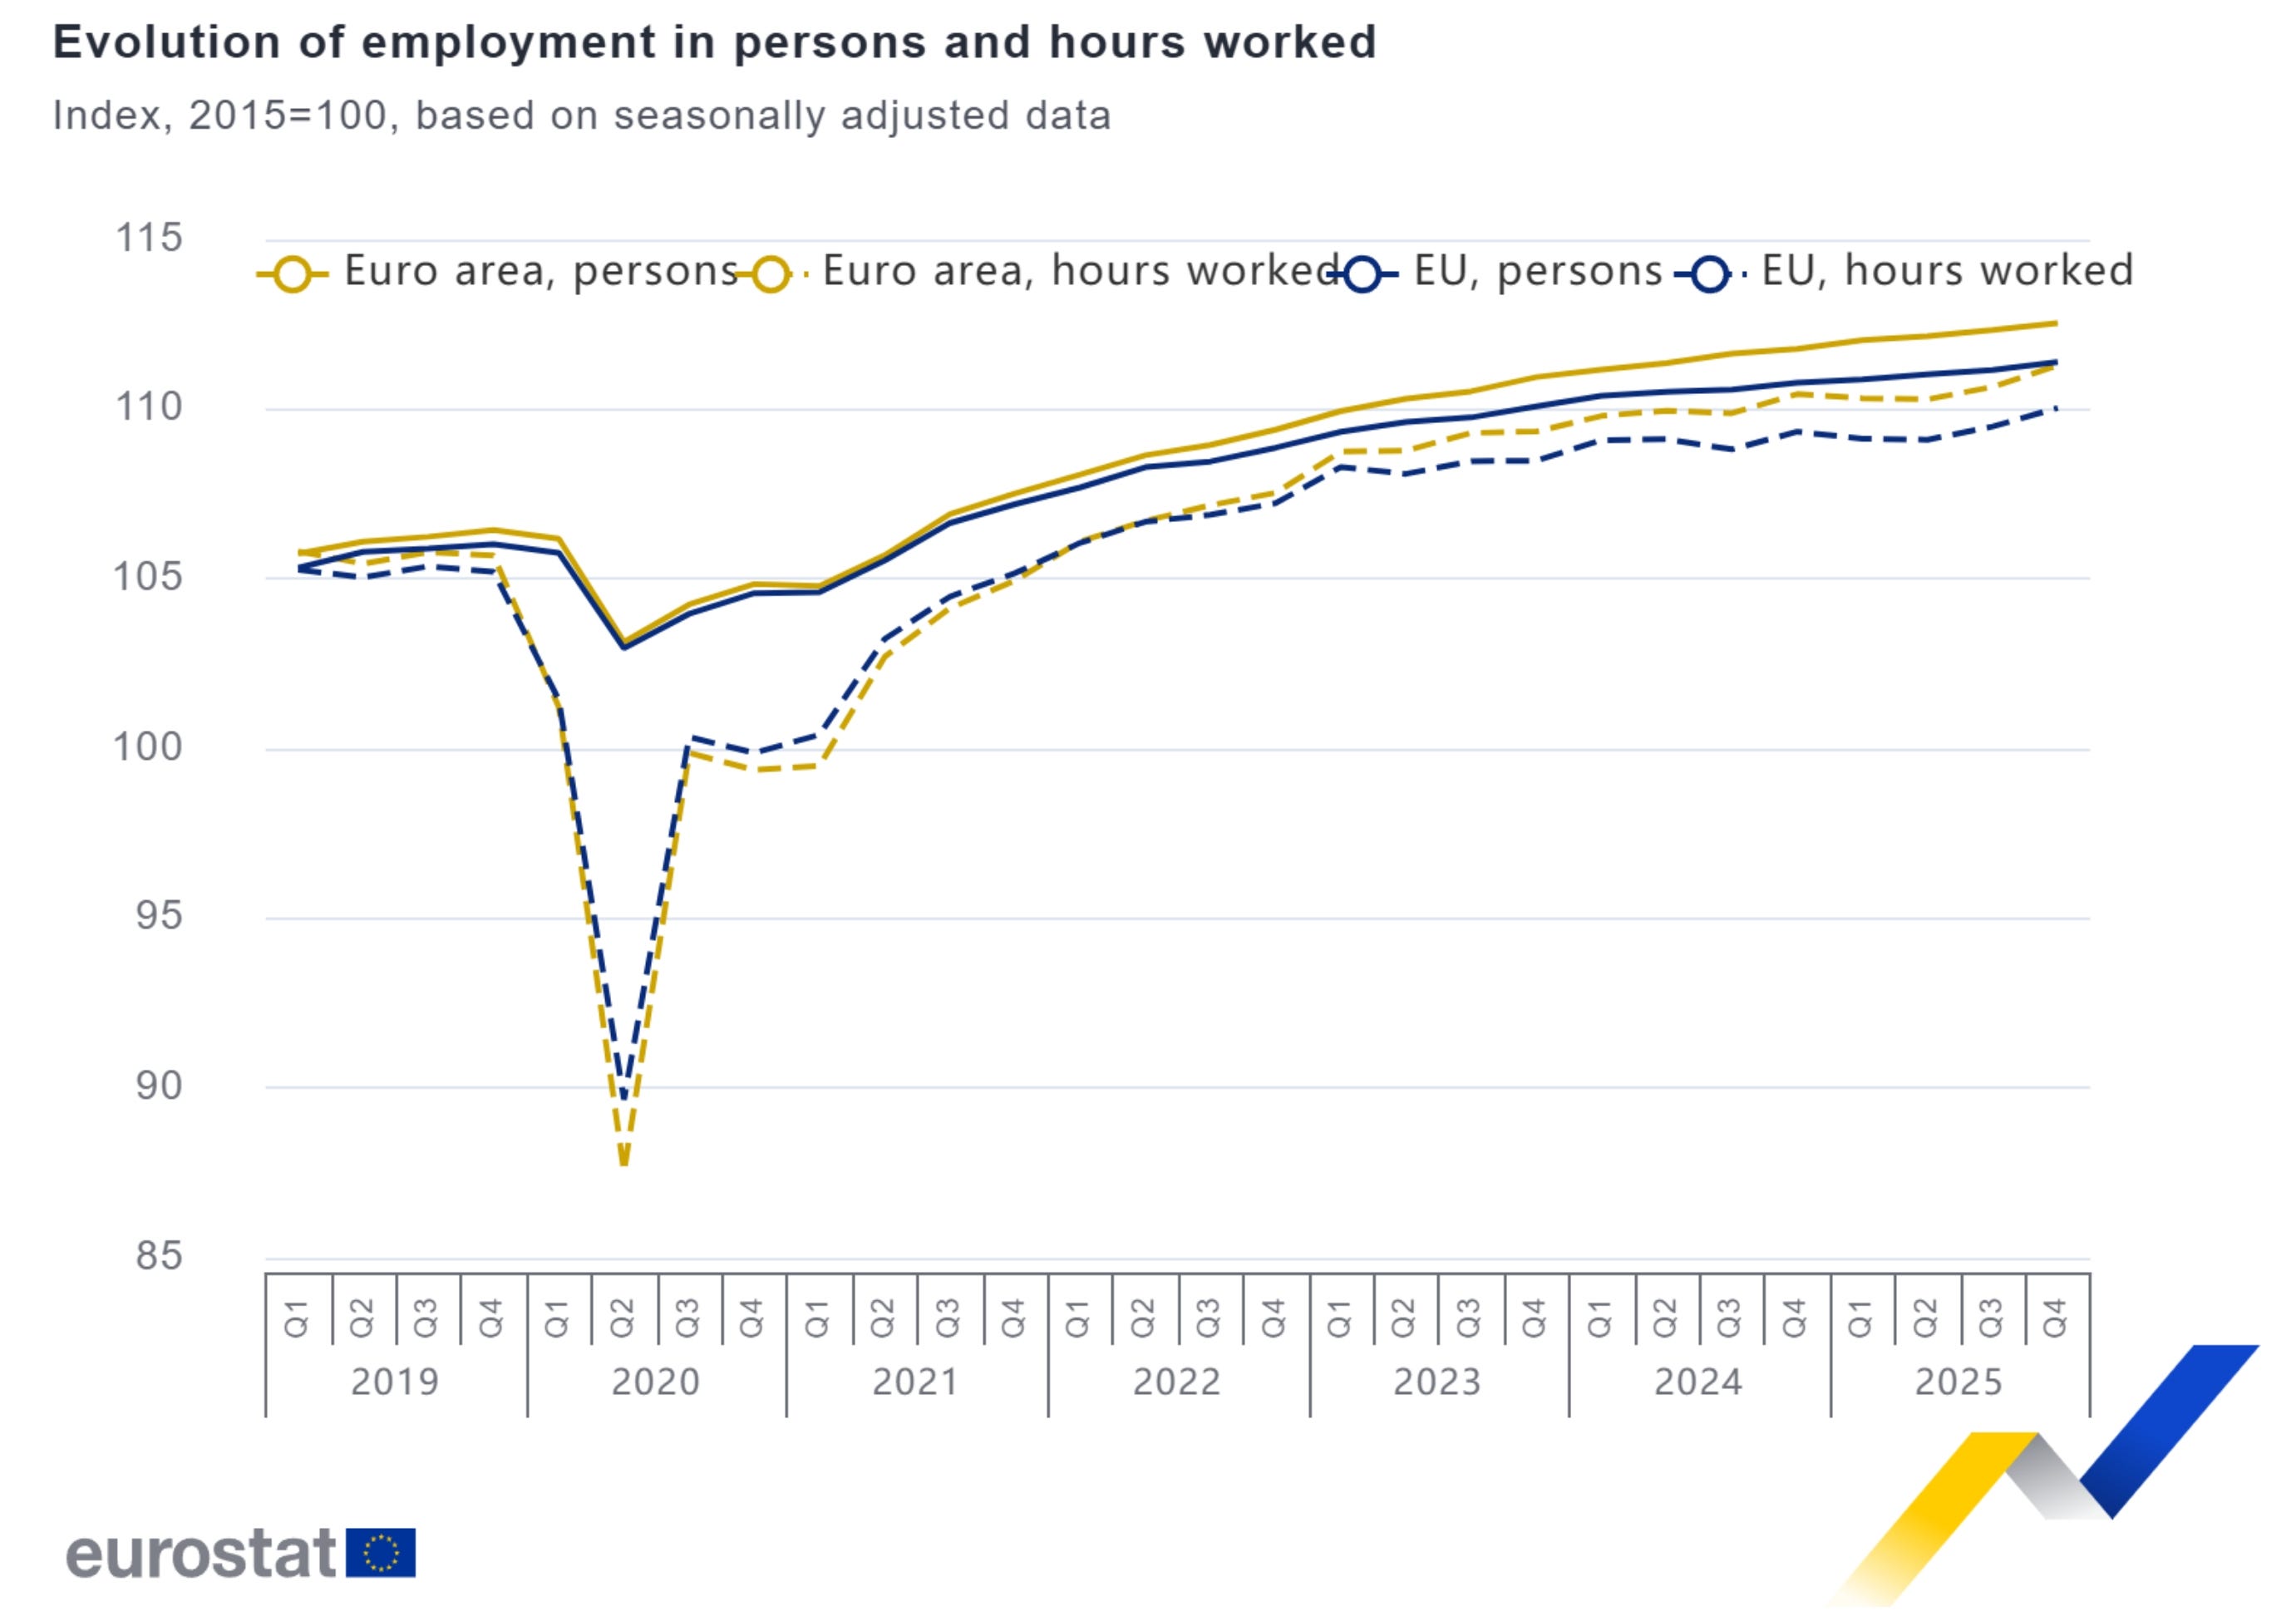
The record low unemployment rate in the European Union countries proves that Europe is strong, the resilient GDP growth keeps the Euro stable and strong. The European labour market is productive and the most efficient, there are no wage price spirals in Europe, which is good.
Figure 20. Record Low Unemployment Rate In Europe:
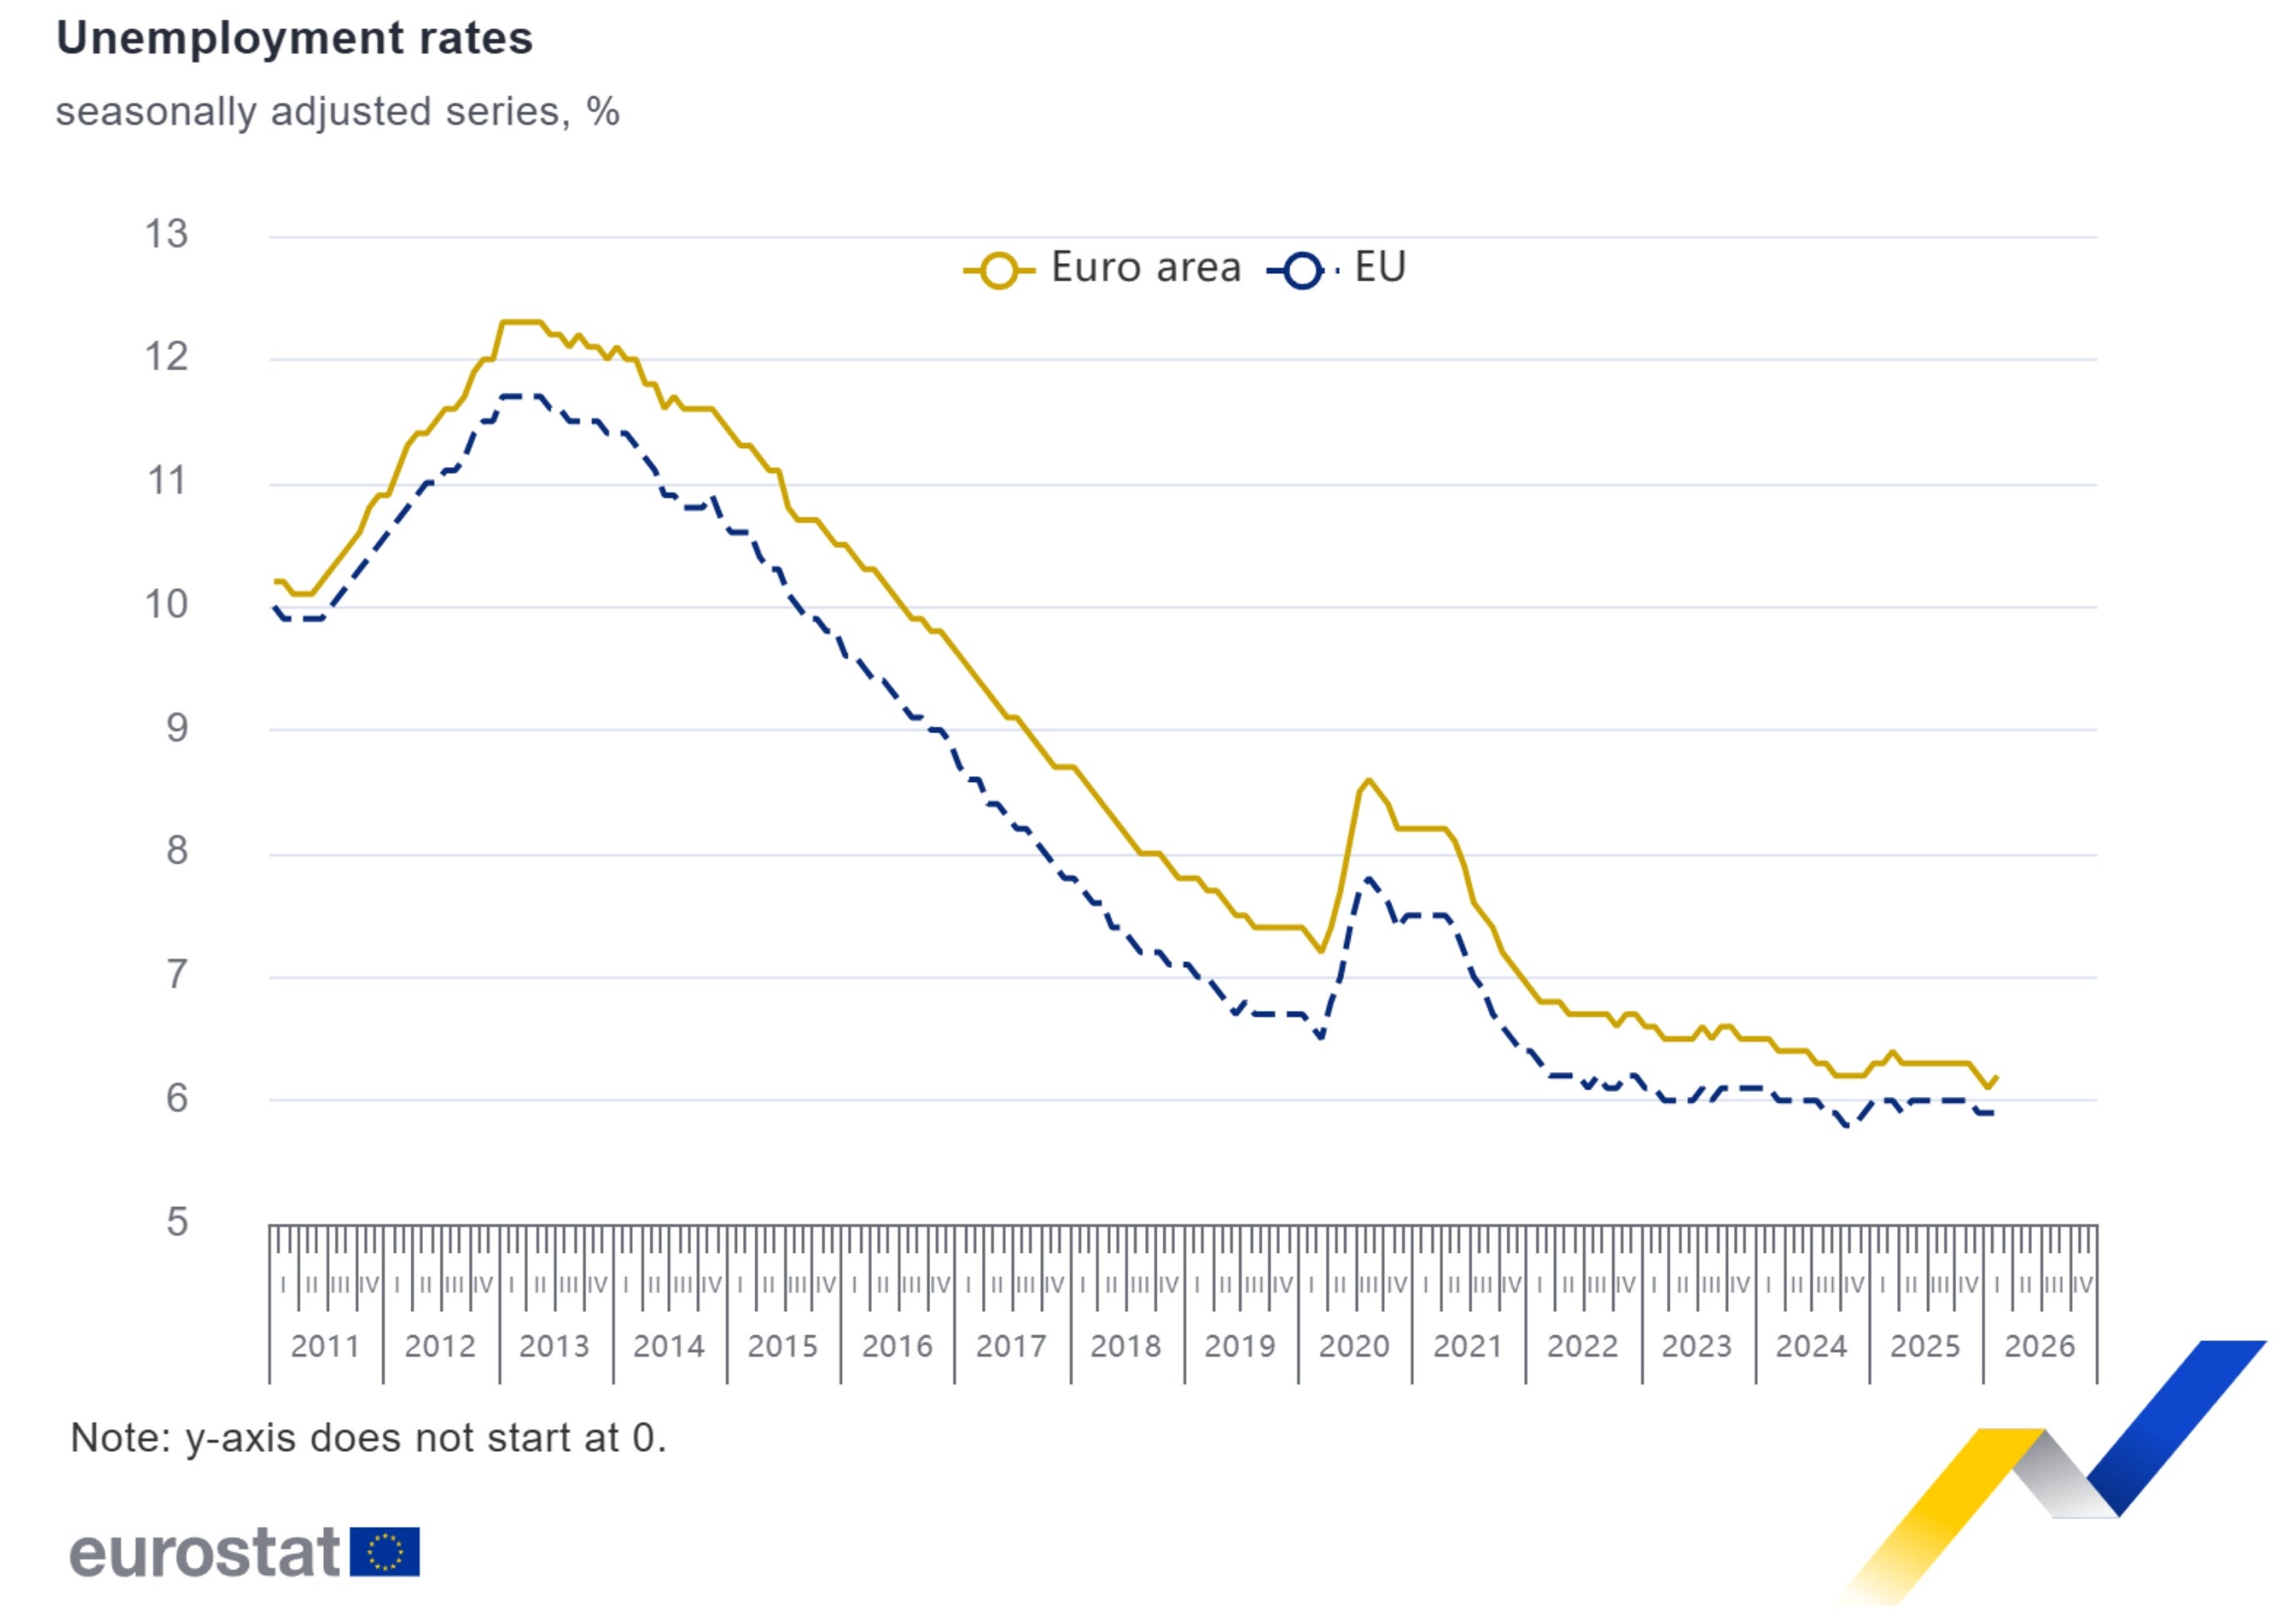
Figure 21. Stable GDP Growth In Europe:
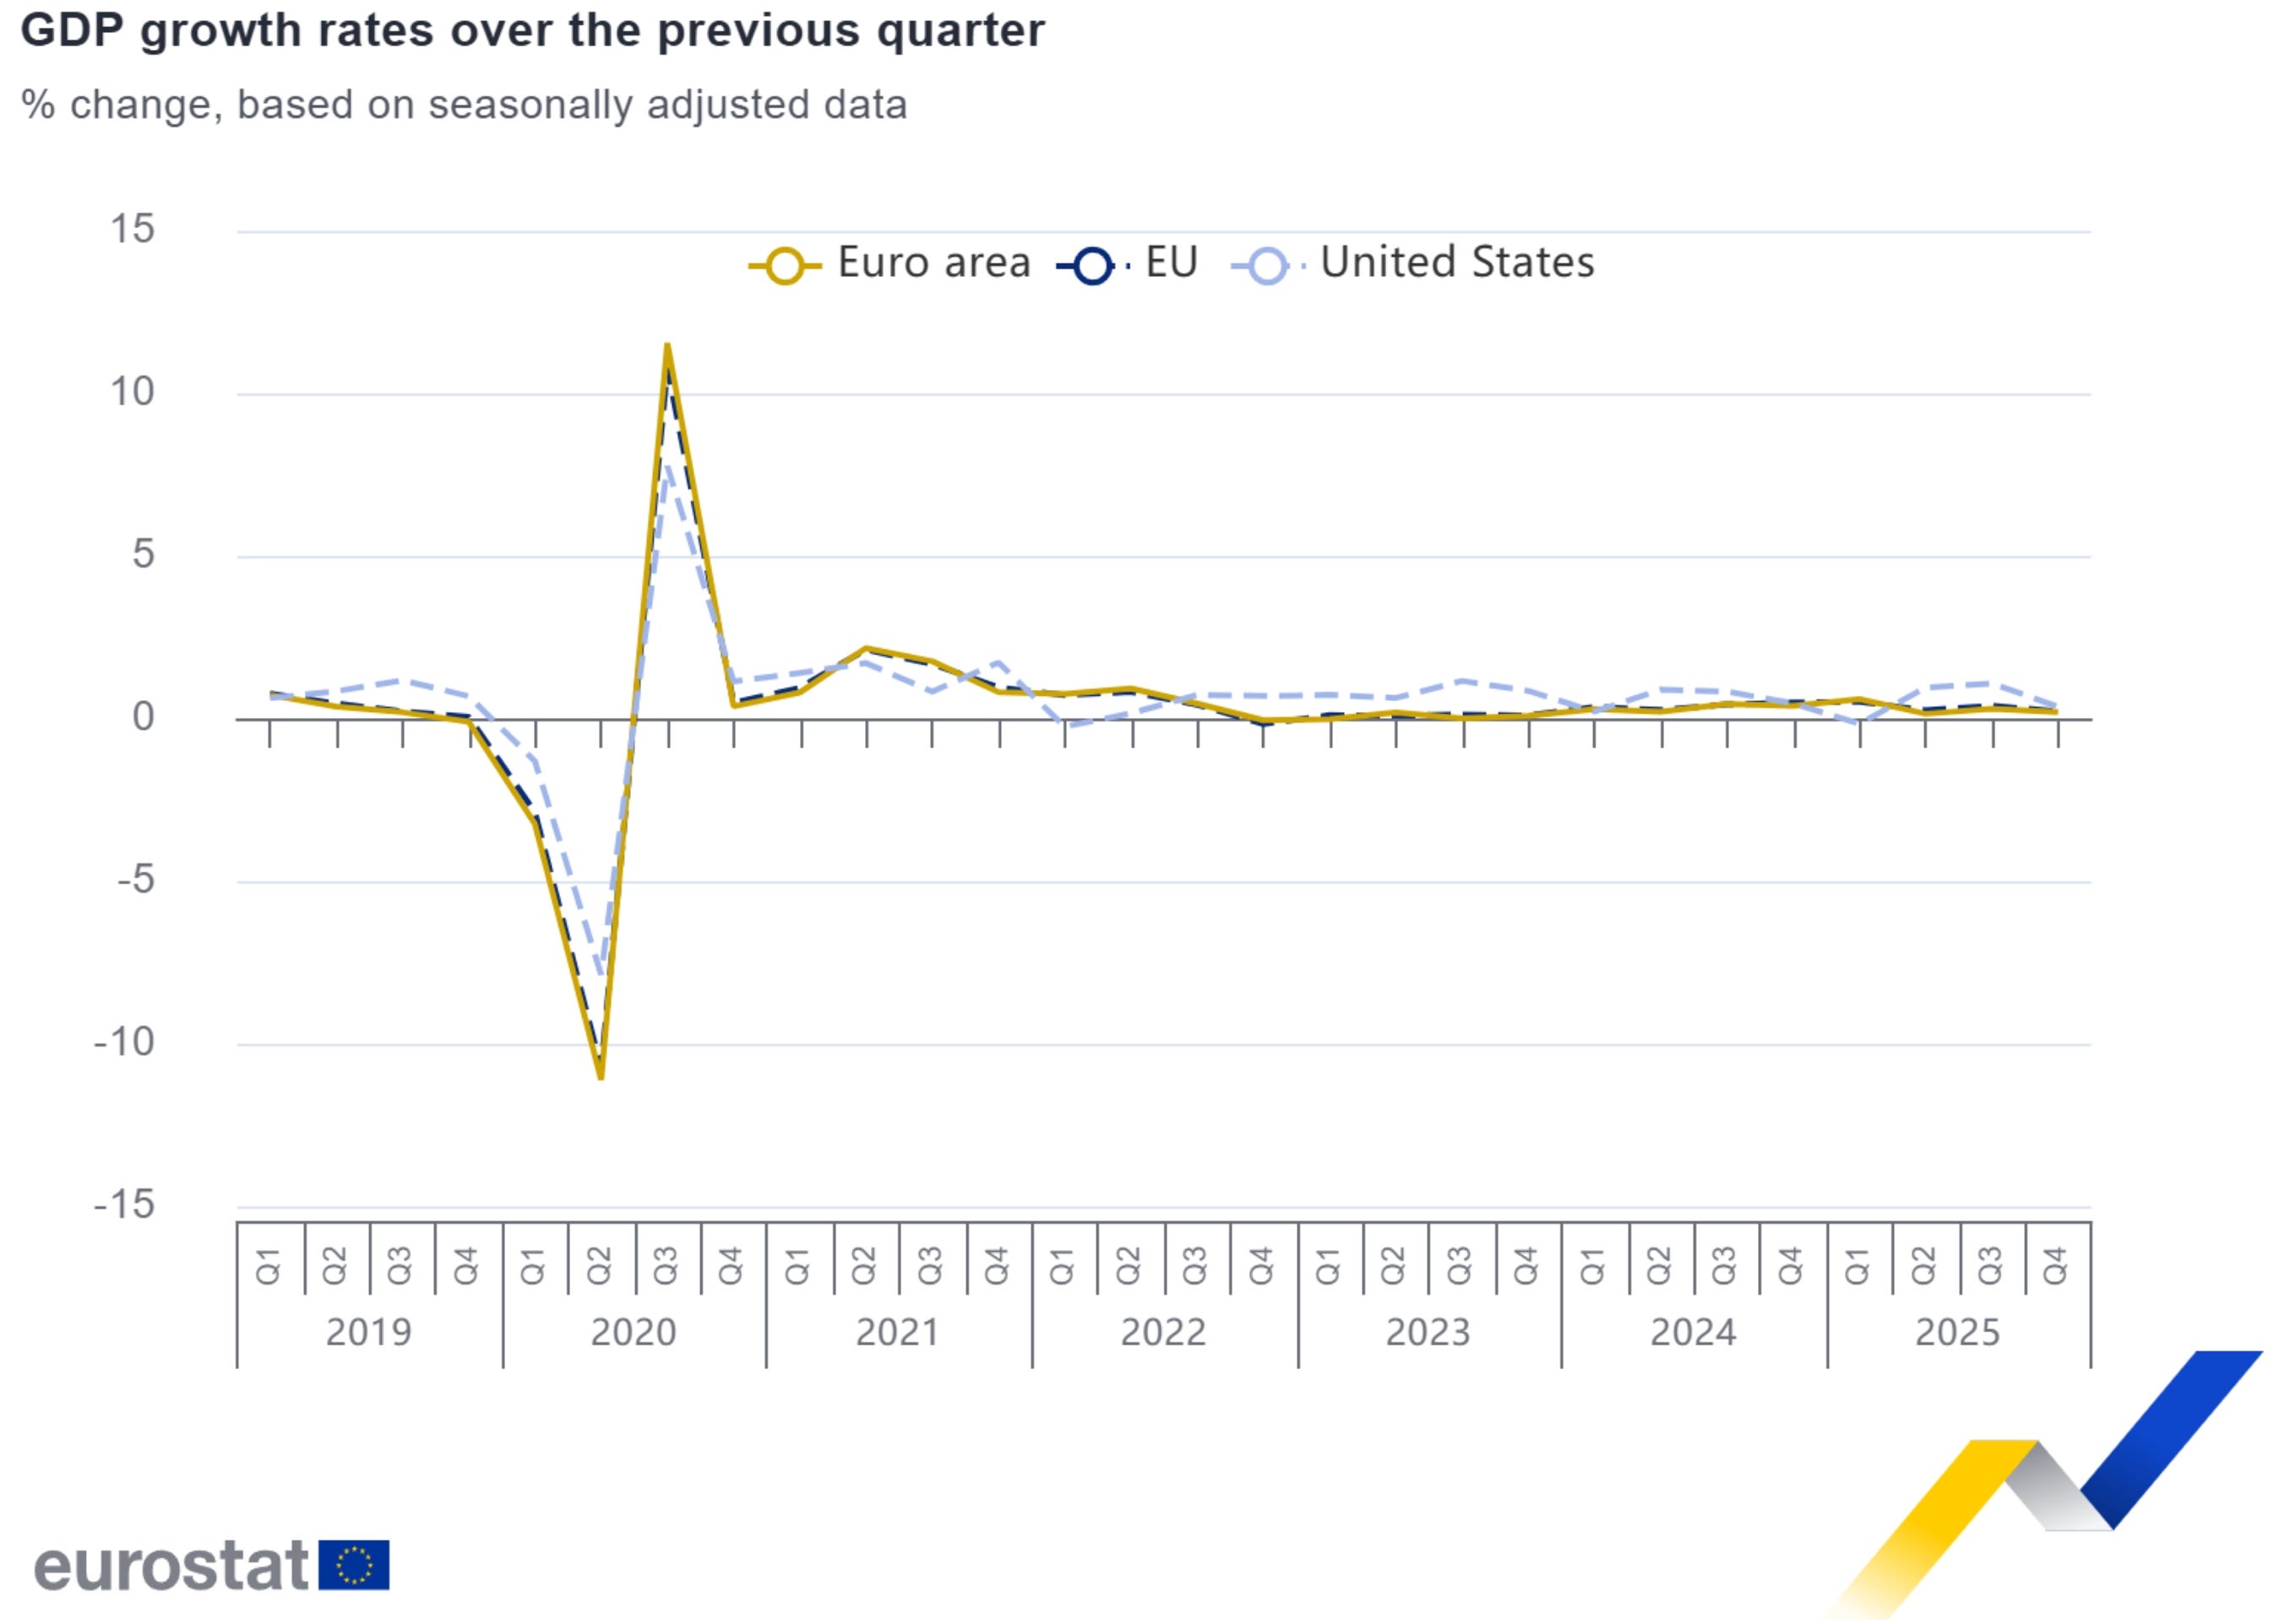
Figure 22. Productive Labor Market In Europe:
The Norwegian natural gas and oil flow keeps Europe stable, Europe benefits from the war indirectly, Norway has a capacity of 362.8 MSm³/day of LNG and 1.970m bbl/day of oil, Europe just needed 30% share of that Norwegian daily natural gas output to replace Russia. Europe has not only achieved supremacy in terms of energy but is also profiting indirectly from the war, the carry trade over the sector is NOK/EUR.
Figure 23.
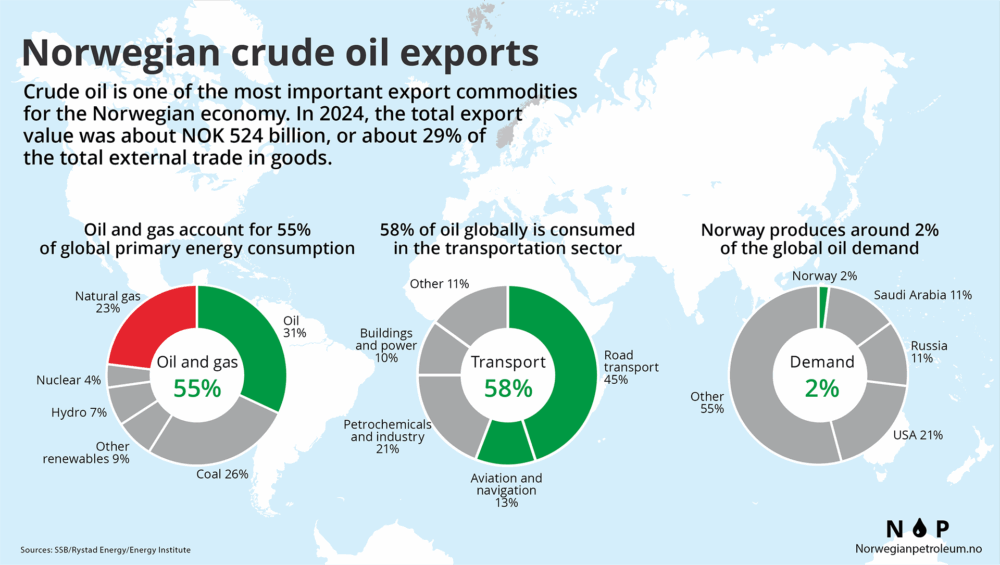
Figure 24.
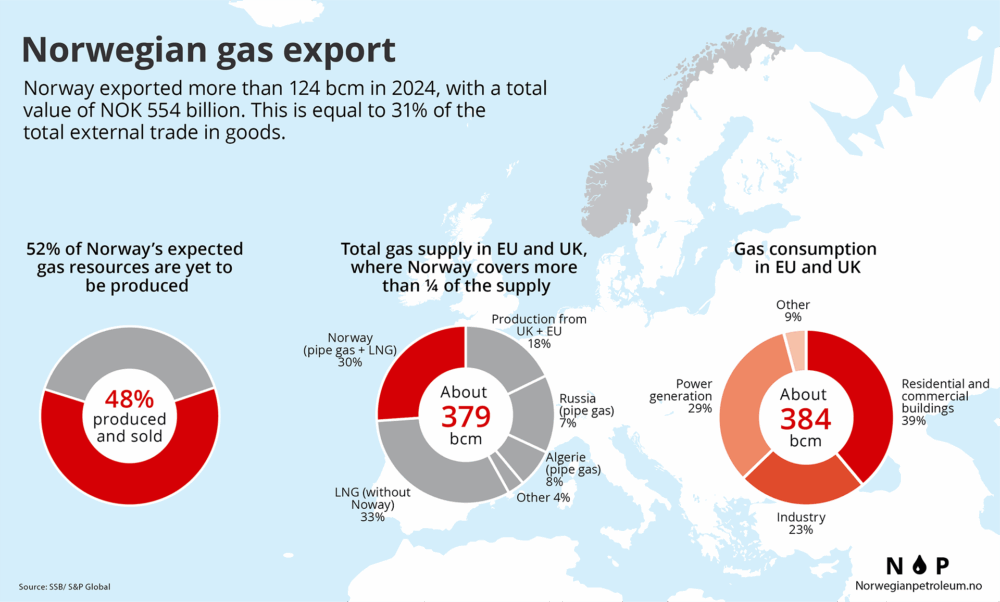
Figure 25. Just 30% of Norwegian Natural Gas Was Needed To Replace Russia.

Figure 26. European Gas Demand Is Below The Mean. (Implying Lower Natural Gas Prices)

Figure 27. The Carry Trade Over Europe And Oil Is NOK/EUR.

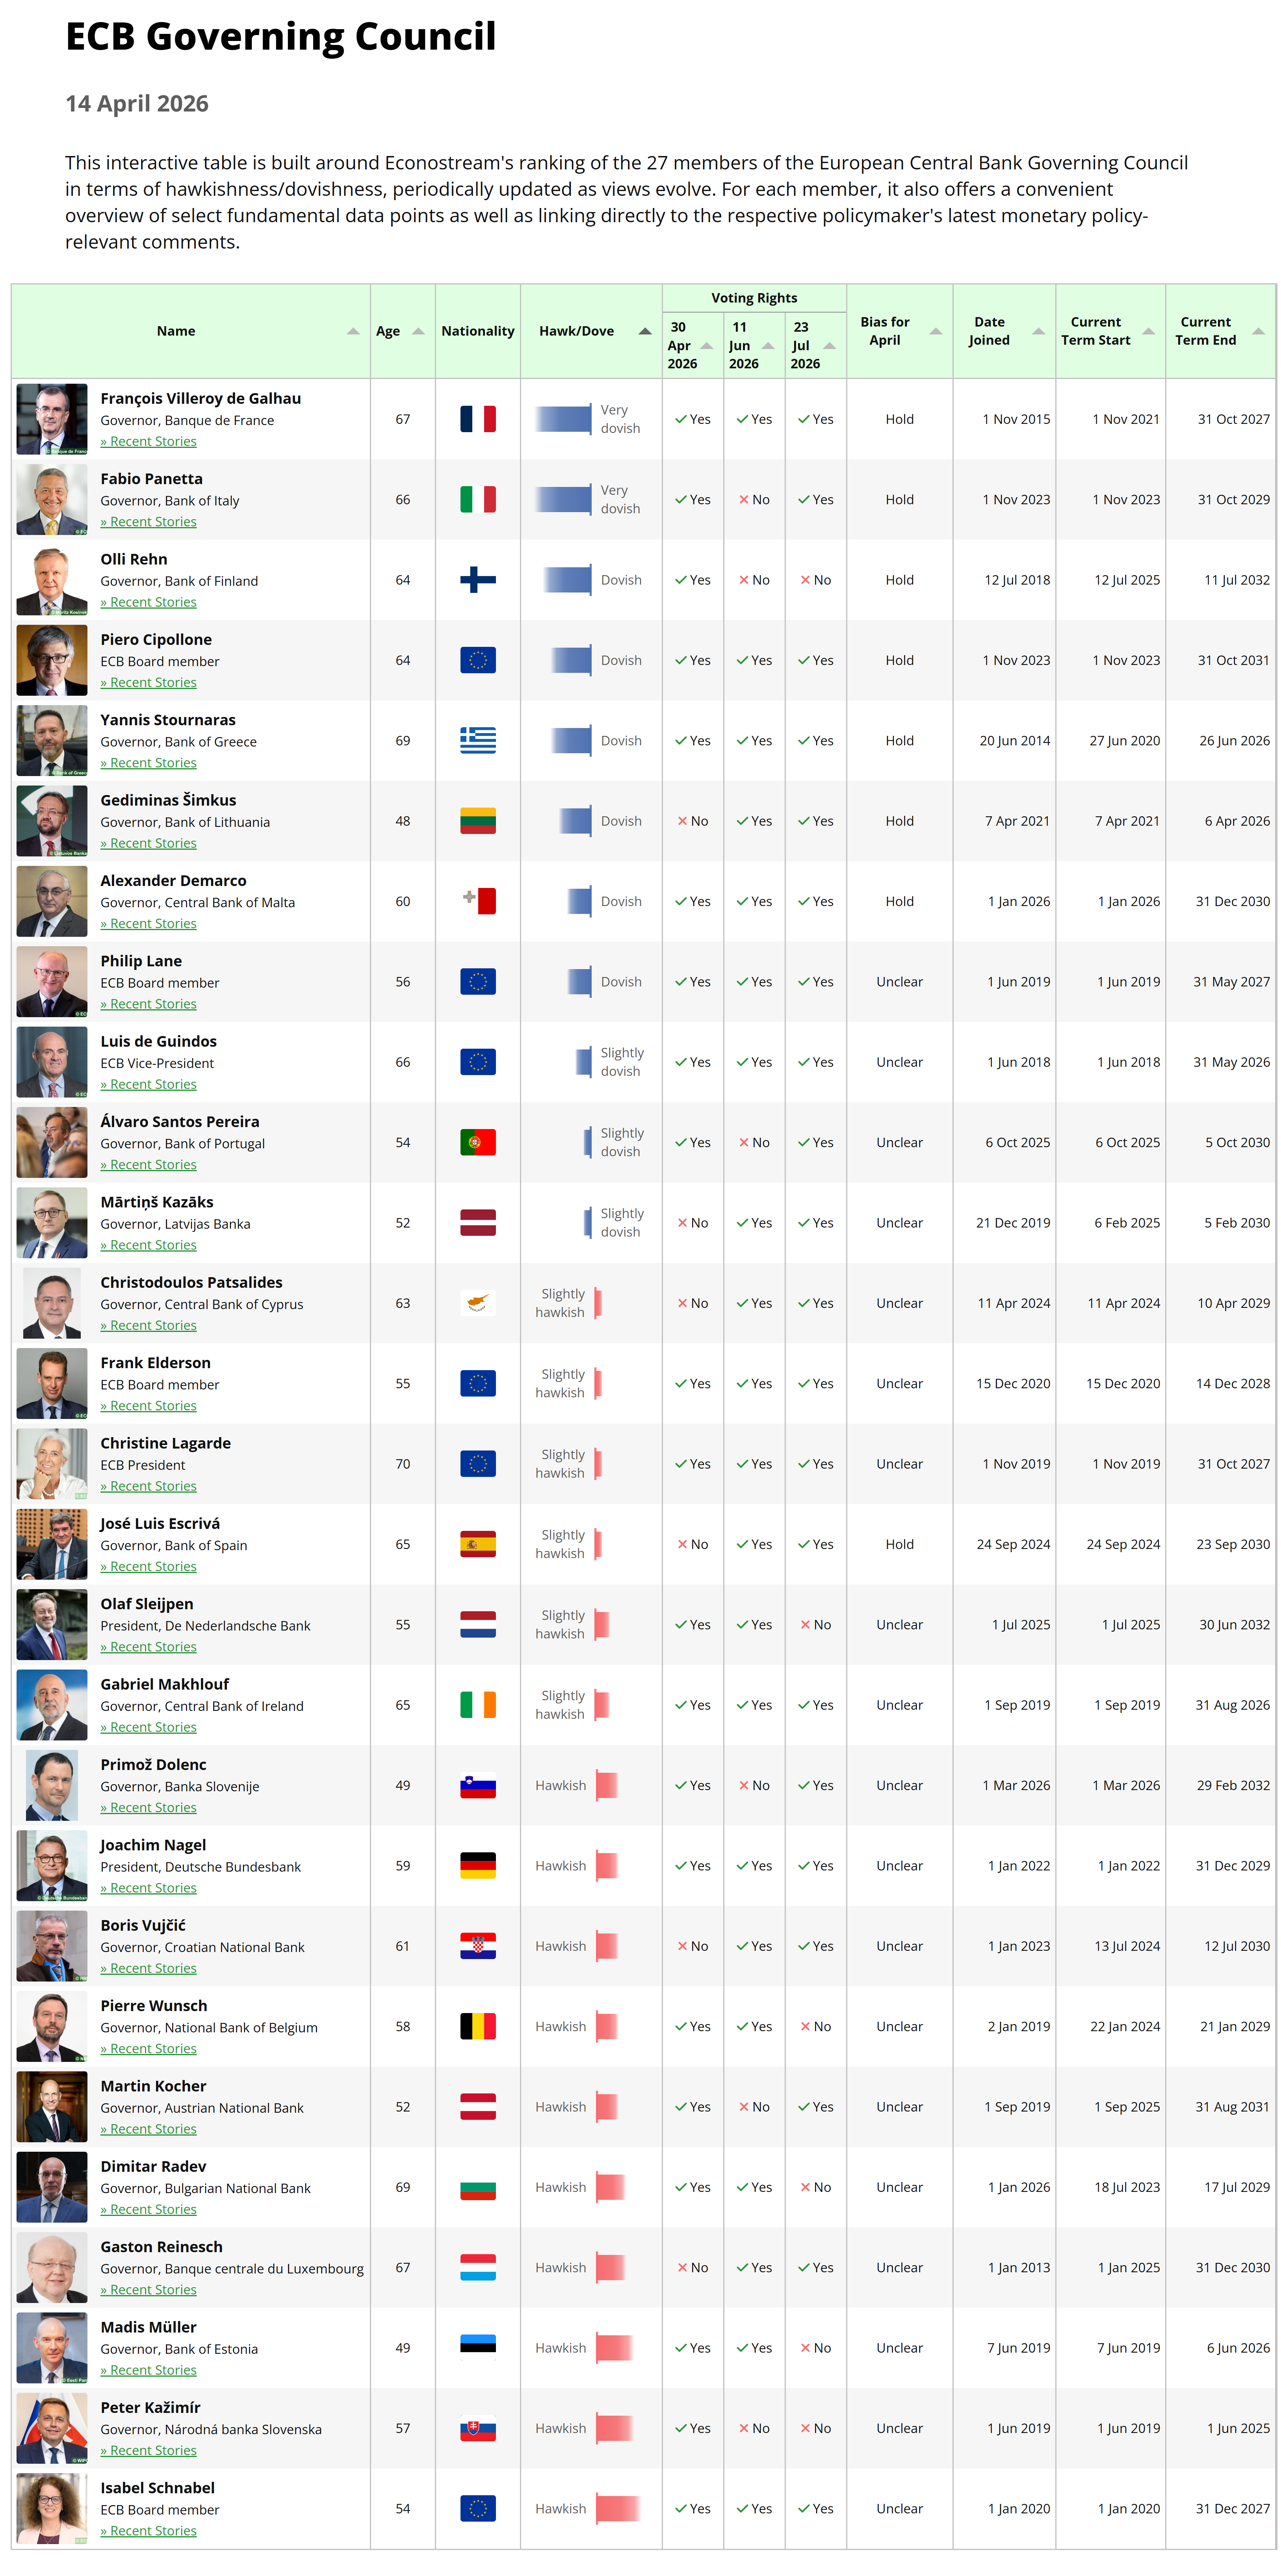
Higher oil and gas prices do imply higher inflation, I do expect rate hikes from the European Central Bank, Ms. Lagarde stance is hawkish-nimble, in line with other members of the European Central Bank.
The play in Europe over the Iran war is Norway ETF NORW 0.00%↑ and Eni SpA E 0.00%↑ stock. Europe has more margin of maneuver to raise rates over inflation spiking than any other given the record low unemployment rate.
﹌﹌﹌﹌﹌﹌﹌﹌﹌﹌﹌﹌﹌﹌﹌﹌﹌﹌﹌﹌﹌﹌﹌﹌﹌﹌﹌﹌﹌﹌﹌﹌﹌﹌﹌﹌﹌﹌﹌﹌﹌﹌﹌﹌﹌﹌﹌﹌﹌﹌﹌﹌﹌﹌﹌﹌﹌﹌﹌﹌﹌﹌﹌﹌﹌﹌﹌﹌﹌﹌﹌﹌
Reflation in China:
The Chinese economy is strong, the Iran war has made China face recession, but I highly doubt that China doesn’t get the oil they want to trade with Iran, even if the United States does a blockade of the Strait of Hormuz. China has won the Iran war without even fighting it.

Producer prices in China are starting to pick up, the spillover effect of it will be materialized in the rest of the world in the next quarter, this implies a ~3% global uptick of inflation next quarter.
Figure 28. China Exits Deflation, For First Time Since 2022:
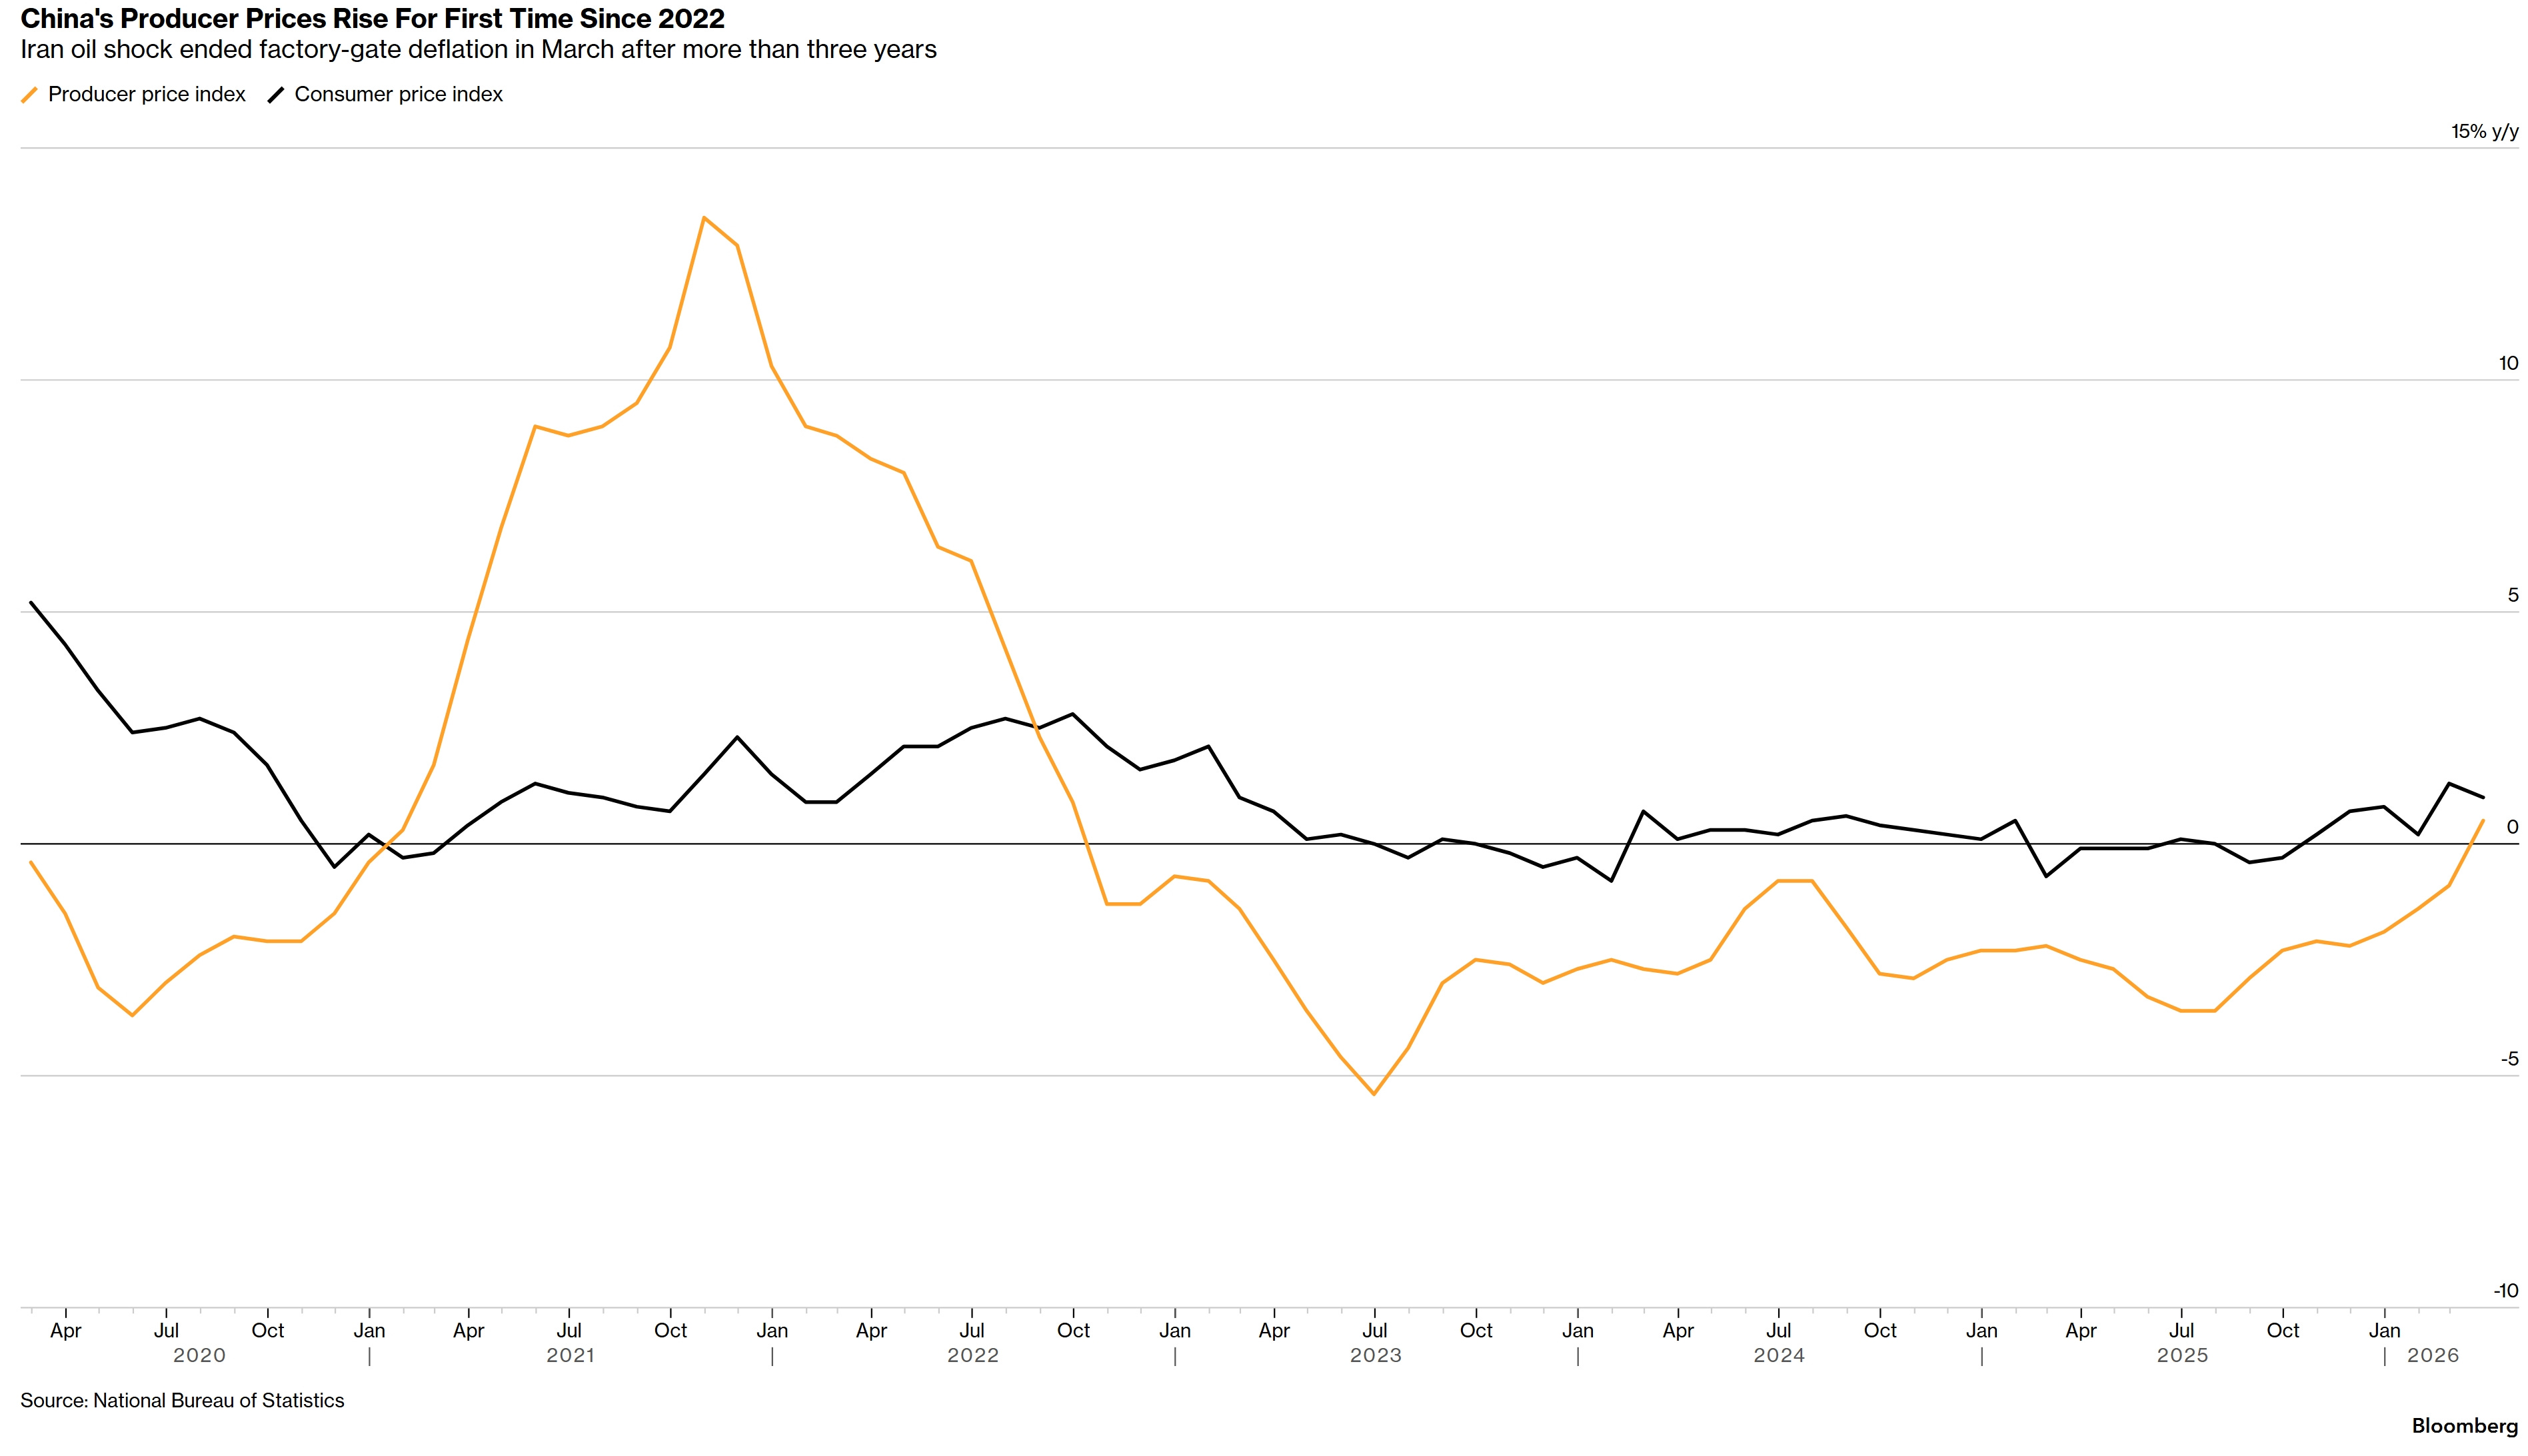
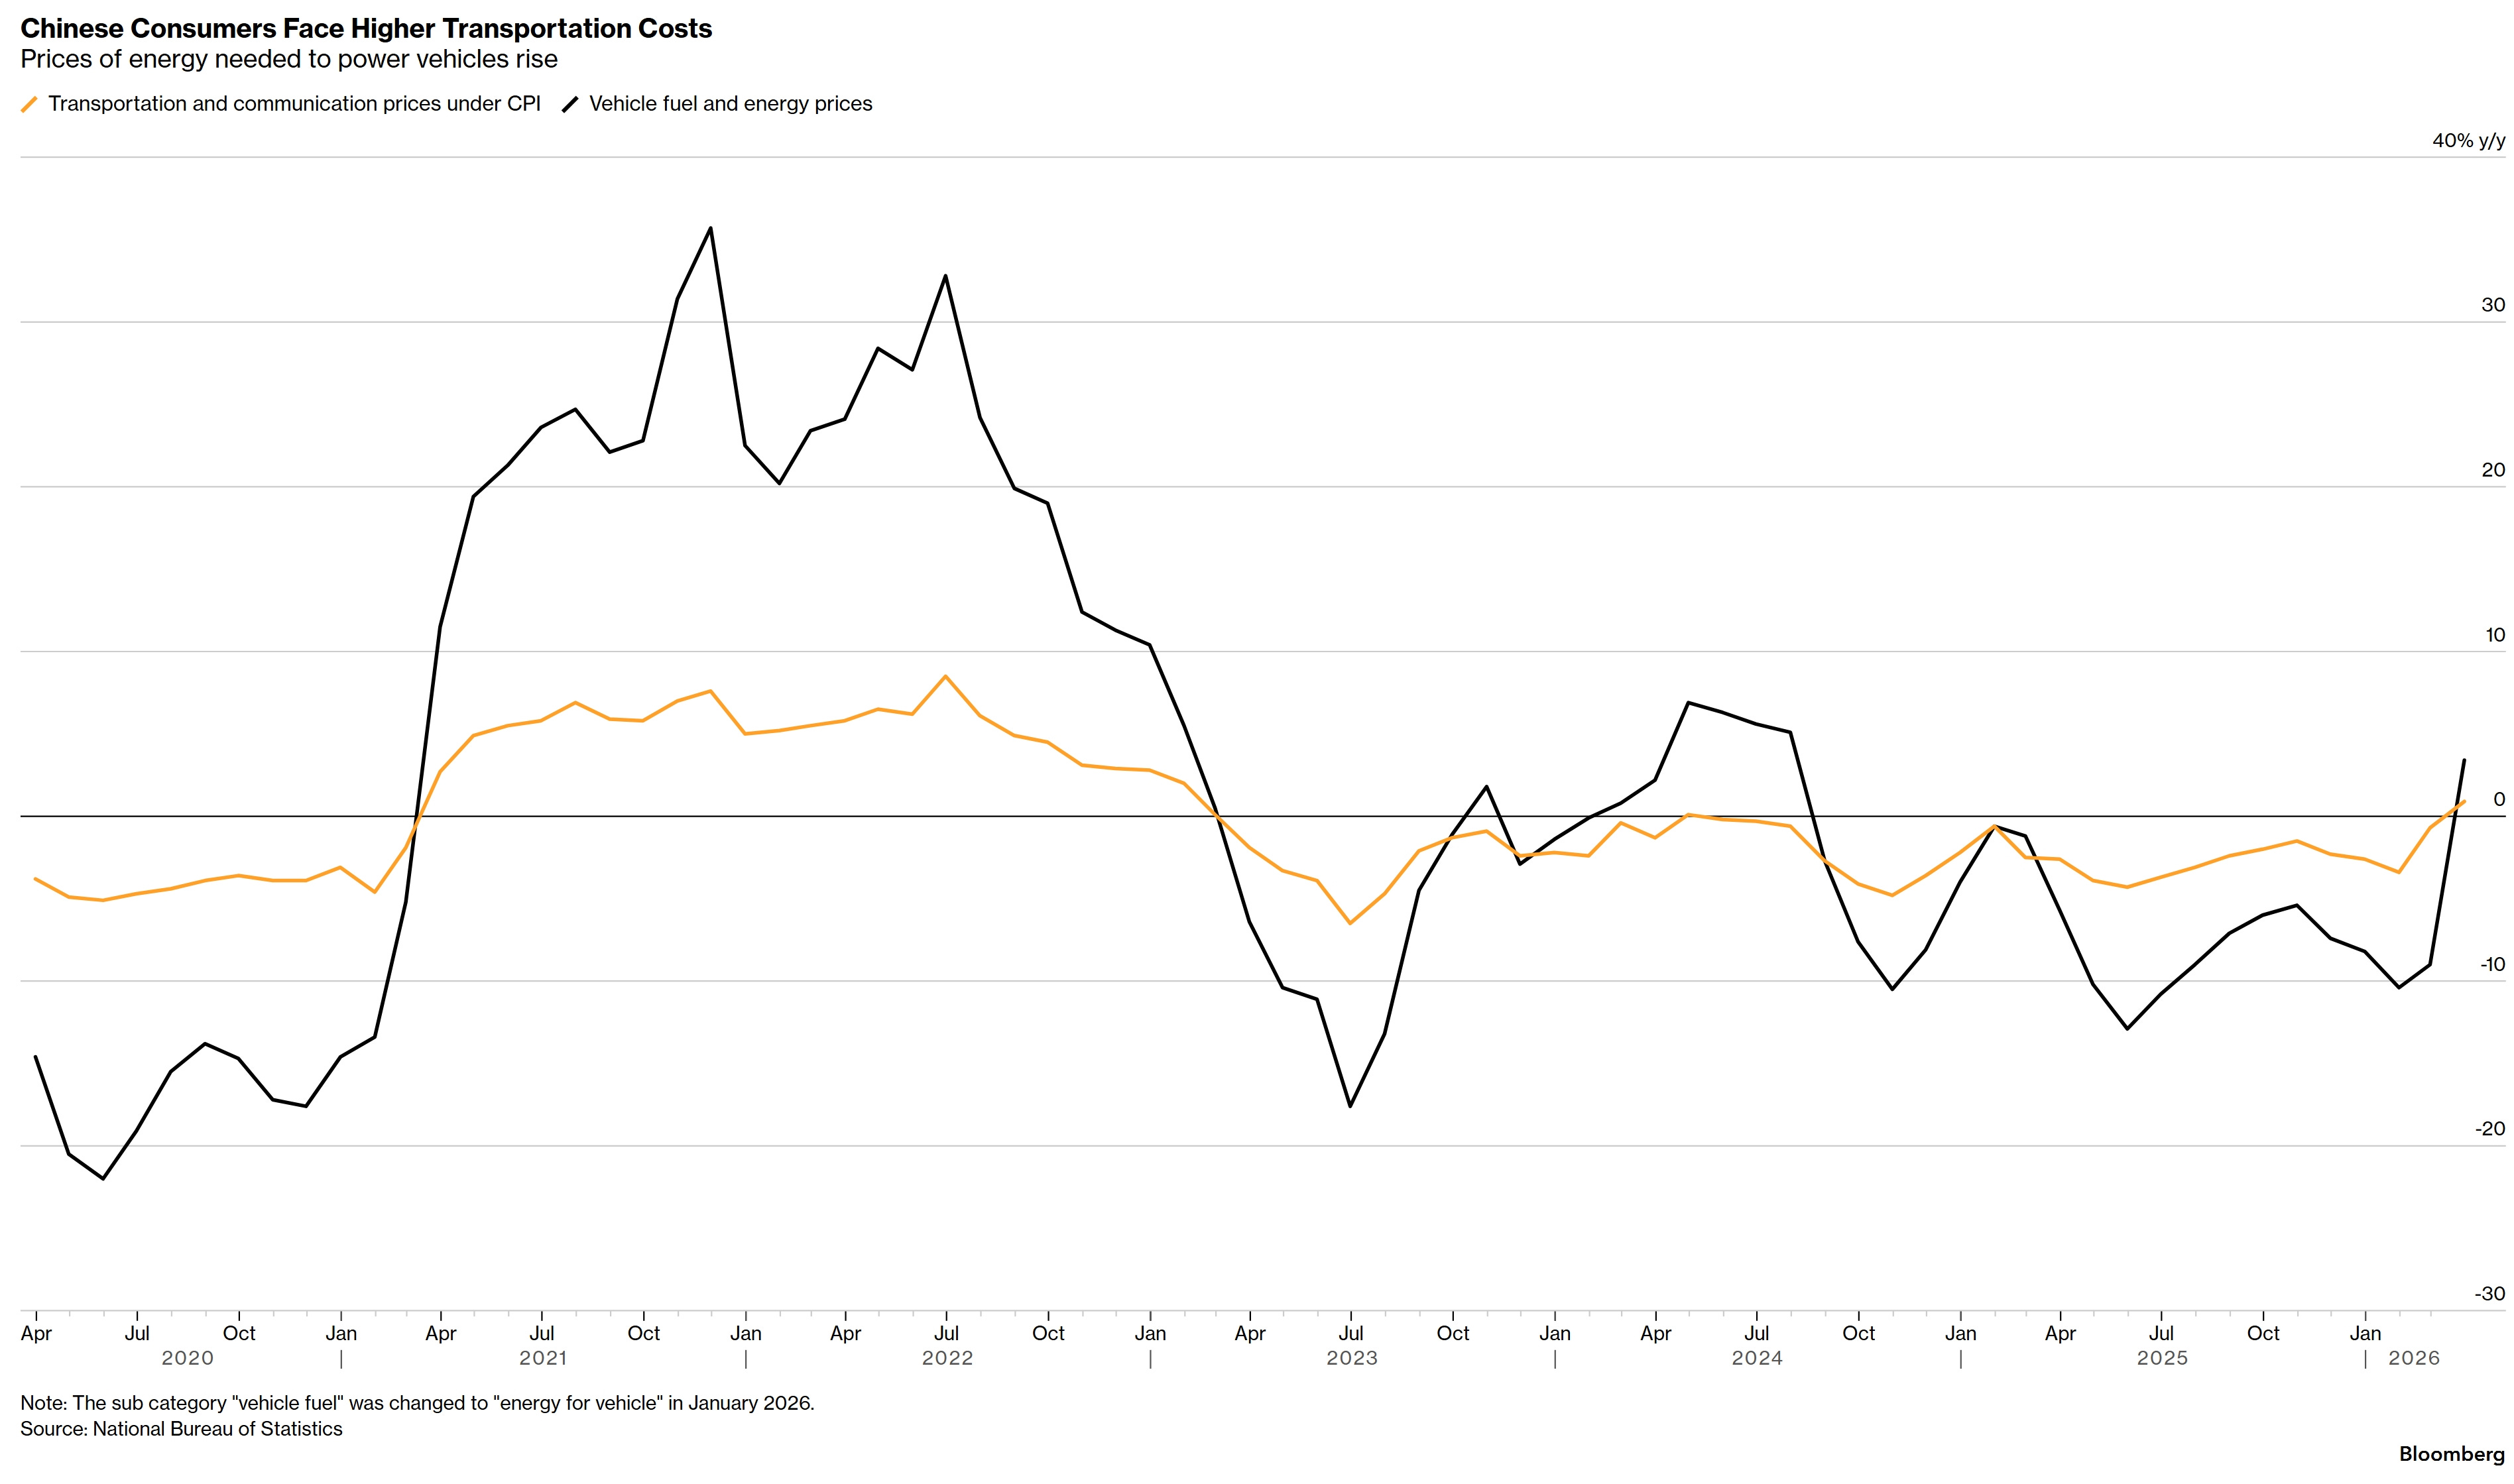
Figure 29. Chinese Consumers Face Higher Transportation Costs:
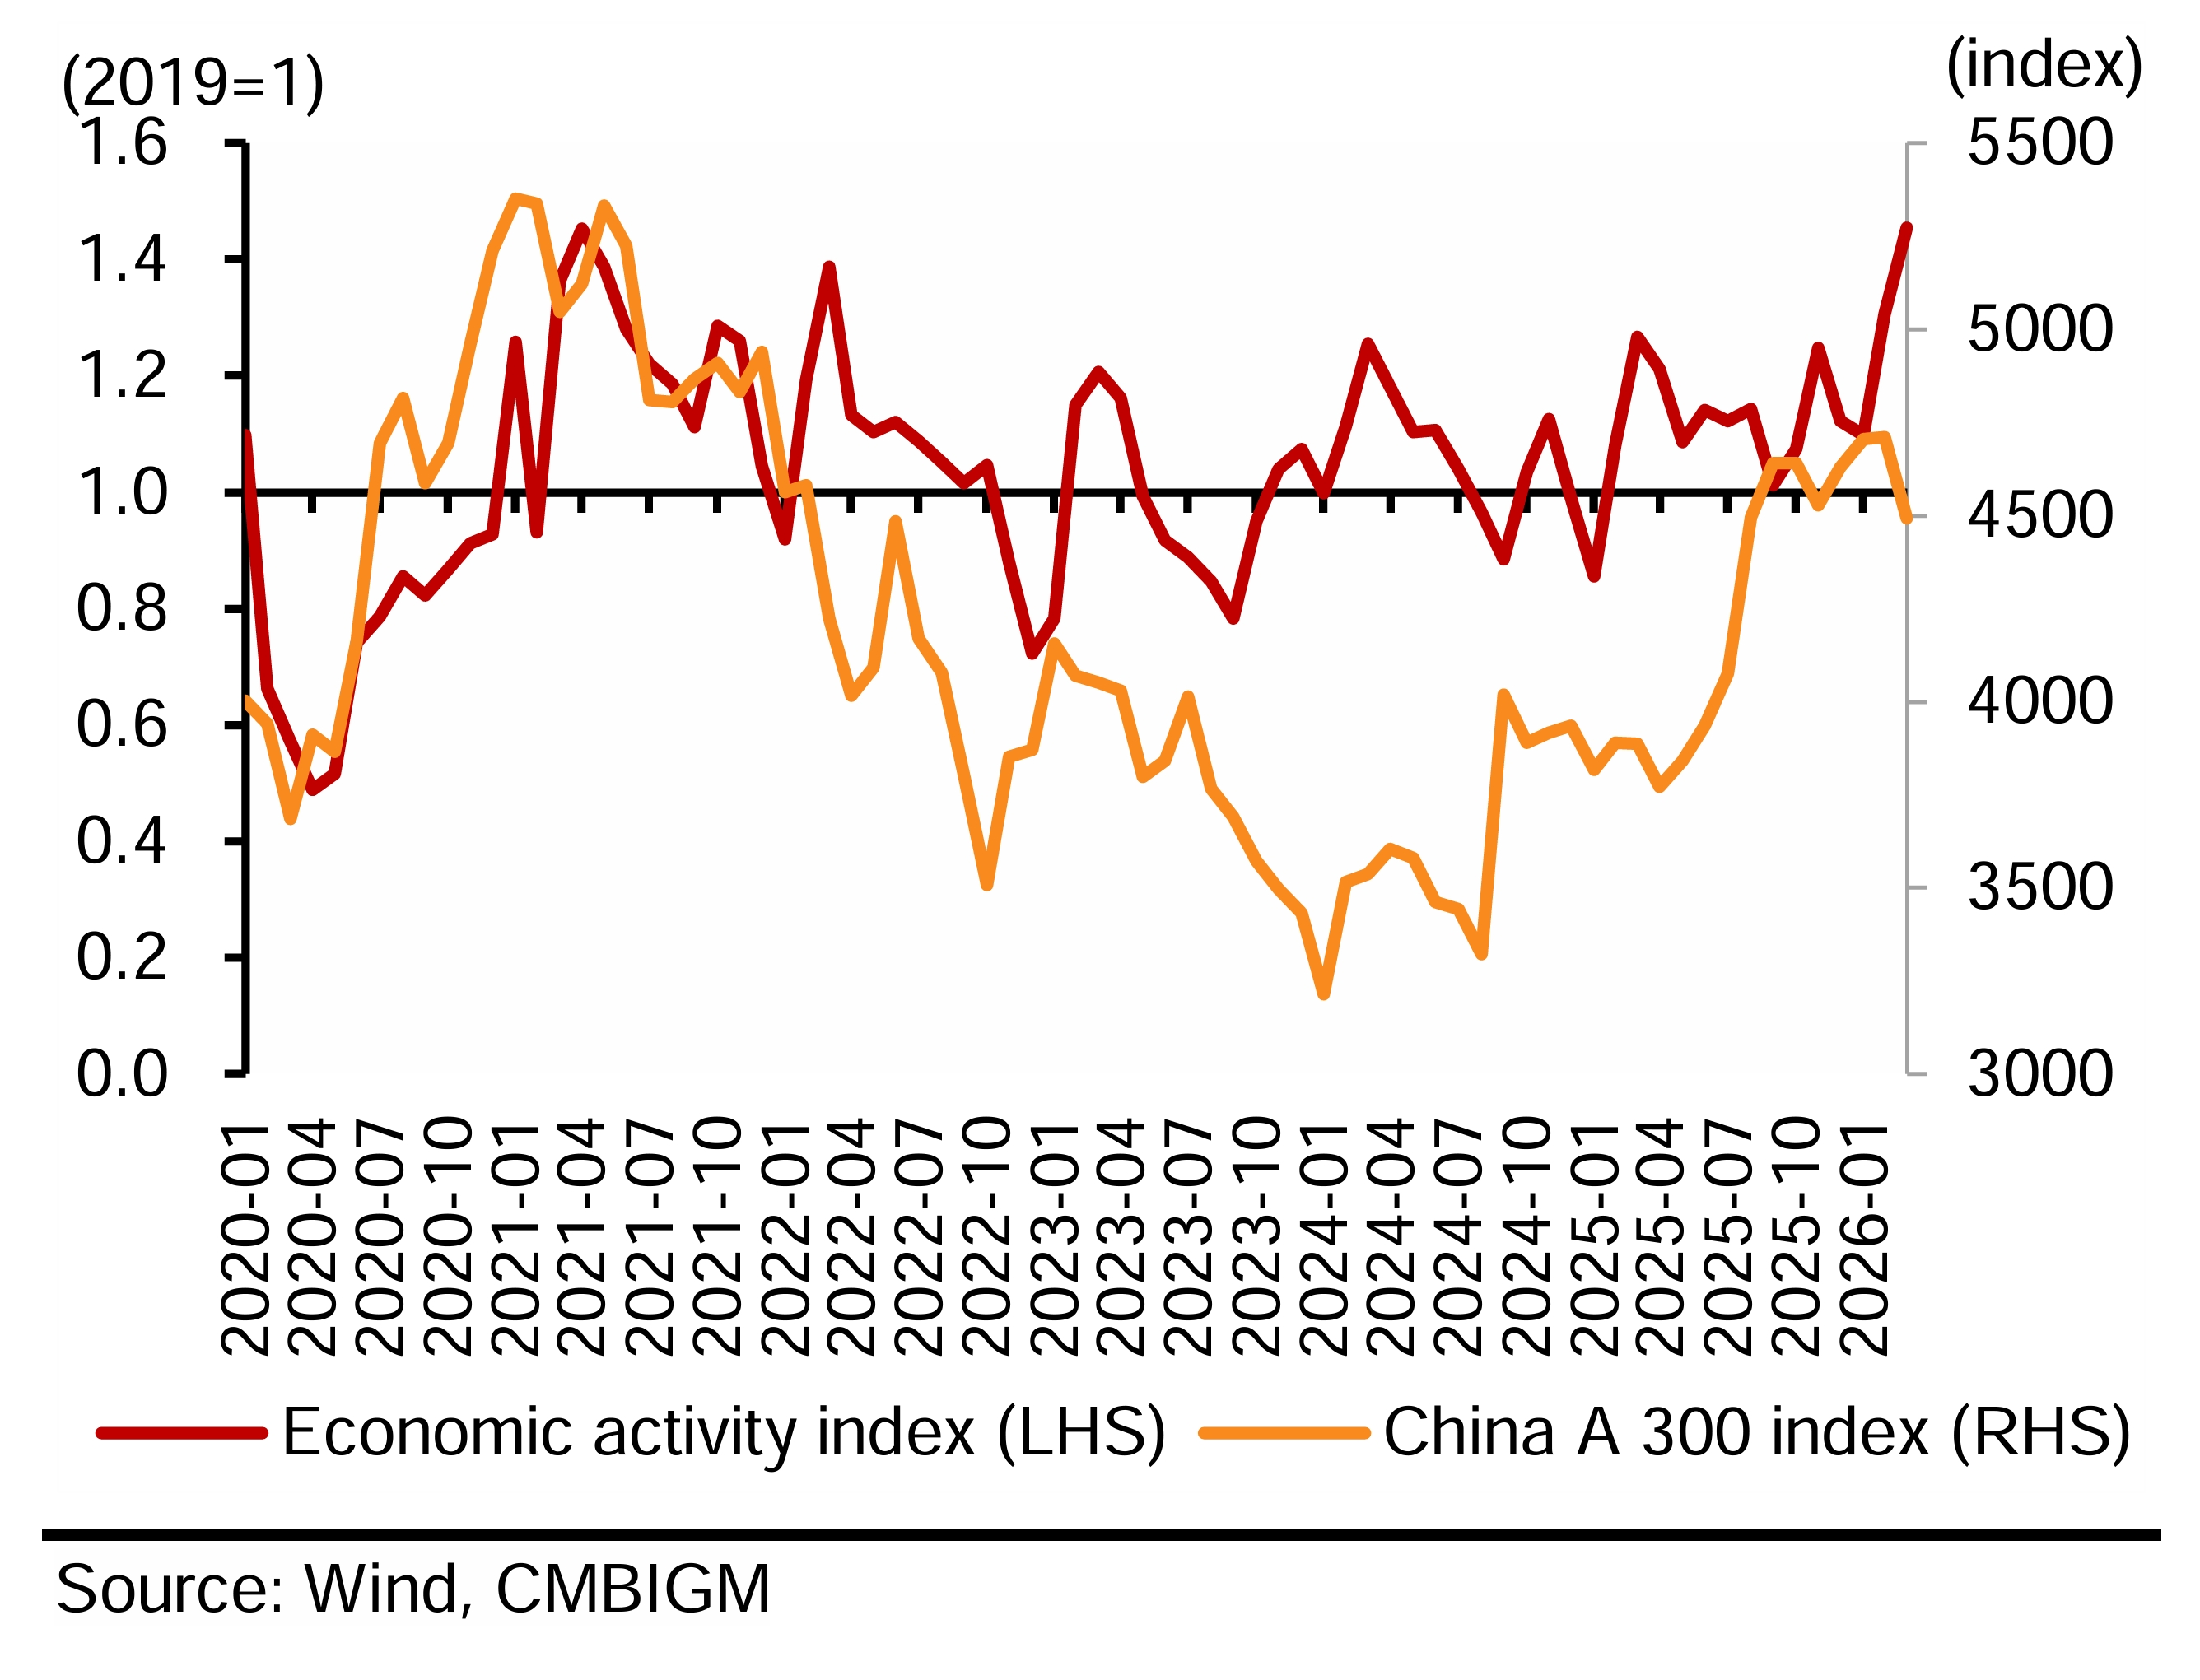
China’s economic activity index, suggests higher index prices in Chinese markets, thus far the Chinese Yuan remains way stronger than market expectations.
Figure 30. China’s Economic Activity Suggests Higher Chinese Equity Prices:

The play over the region is long energy, short airlines given increase in jet fuel prices.
﹌﹌﹌﹌﹌﹌﹌﹌﹌﹌﹌﹌﹌﹌﹌﹌﹌﹌﹌﹌﹌﹌﹌﹌﹌﹌﹌﹌﹌﹌﹌﹌﹌﹌﹌﹌﹌﹌﹌﹌﹌﹌﹌﹌﹌﹌﹌﹌﹌﹌﹌﹌﹌﹌﹌﹌﹌﹌﹌﹌﹌﹌﹌﹌﹌﹌﹌﹌﹌﹌﹌﹌
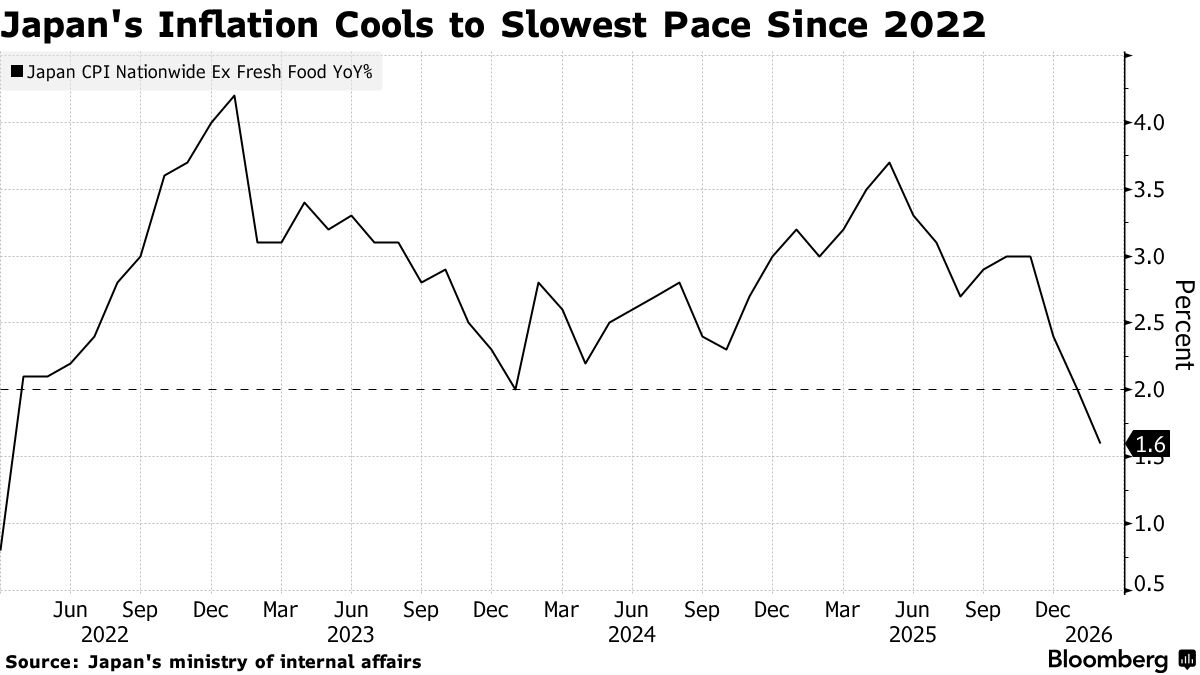
Deflation in Japan:
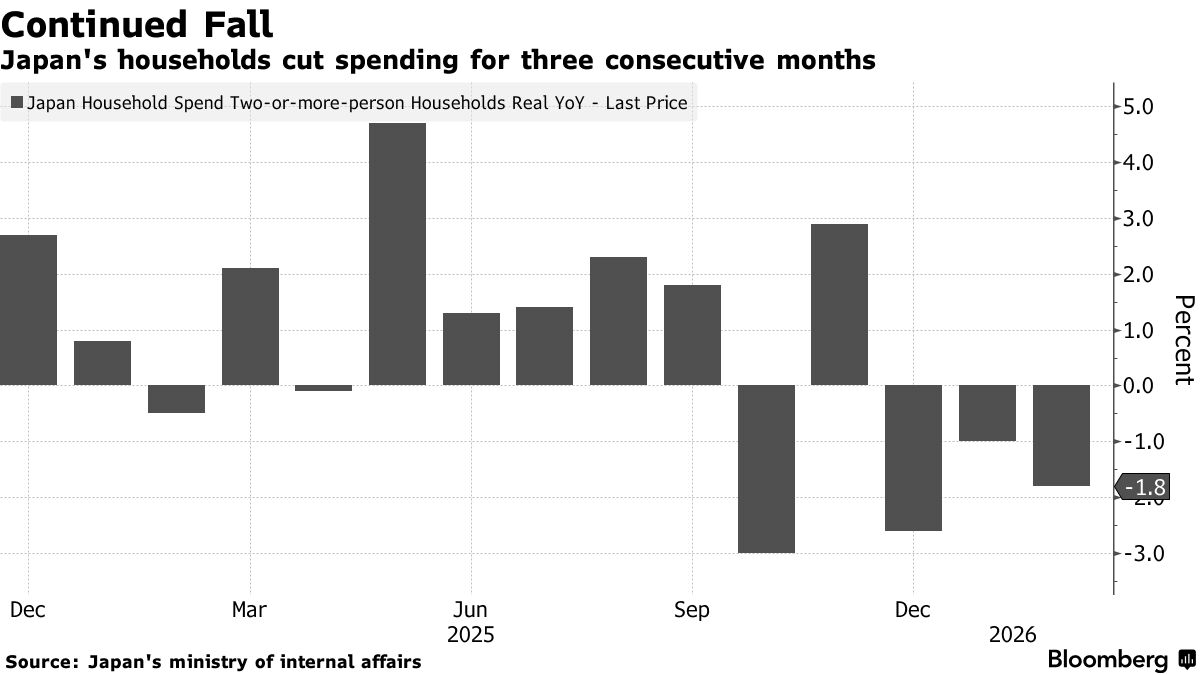
The Japanese economy is facing stagflation, there are sings of wage price spirals going on in Japan, with mixed signals in regions of Japan but clear message in wages. Japanese households cutting spending suggests growth concerns that should be addressed by government tax cuts, I expect rate hikes.
Figure 31. Japanese Households Cut Spending:

Figure 32. Plausible Wage-Price Spiral Forming:
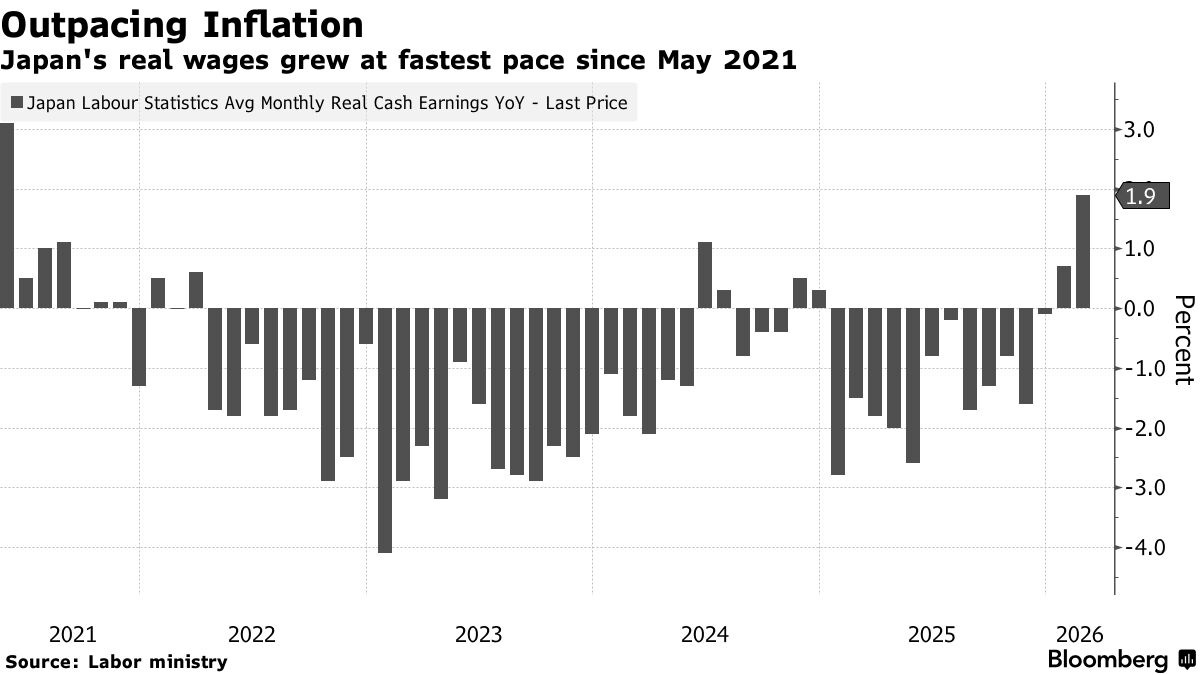
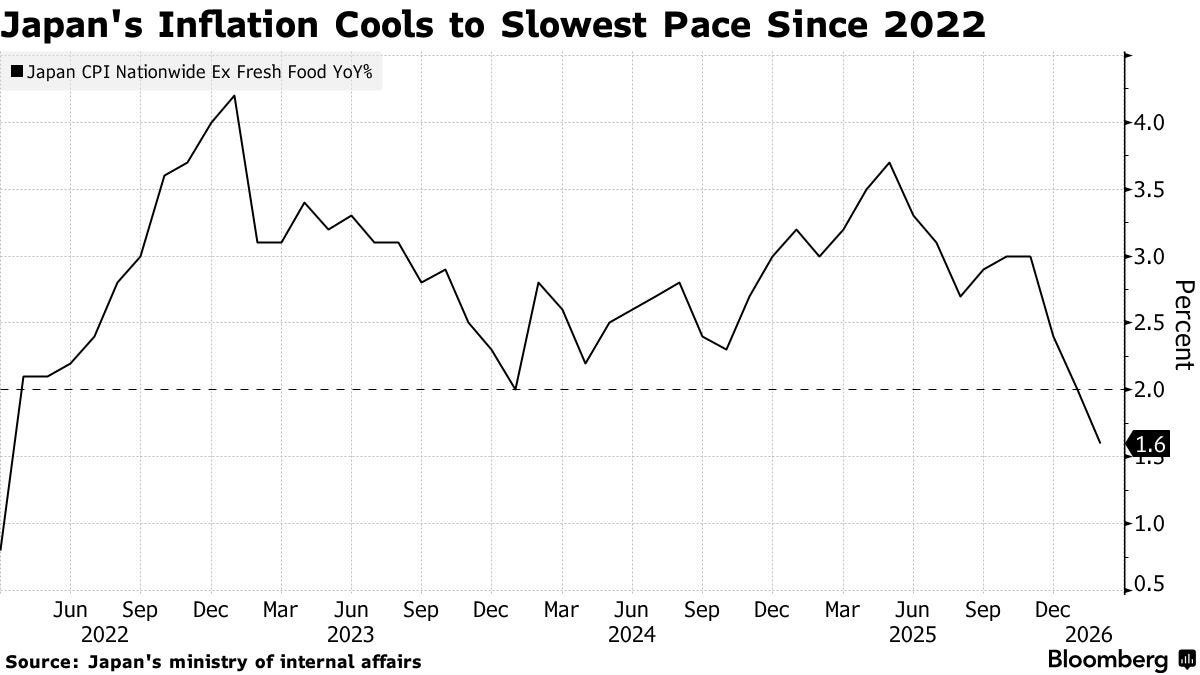
Figure 33. There’s Deflation In Japan:
The Japanese government has strong approval from its people, I strongly believe that the Japanese stock market is undervalued.
Figure 34. Impressive Rally In Japan’s Nikkei225 Index:

To conclude, the Japanese government has to just cut spending and increase taxes in the long run to stabilize the Yen, the rest is the Bank of Japan’s job to do, raising the rates would curve speculative price action in the Yen and help to stabilize it through open market operations.
I highly recommend to read my previous post to better understand the current geopolitical scenario:
